This week’s review covers major altcoins and selected mid/low-cap tokens (see separate update for BTC and ETH). Focus is on macro structures, key support/resistance zones, and expected mid-term scenarios through Autumn.

 BNBUSDT
Pulled back to the local support highlighted earlier this week. I would prefer to see a more prolonged consolidation before the next higher low forms and one more break-out into the macro resistance zone at 930–1000. However, a sustained break above Thursday’s high would increase the odds of more immediate upside momentum, potentially bypassing the longer consolidation phase.
Chart:
 XRPUSDT
Is following the corrective structure outlined in the previous weekly report. A double bottom formation is possible at current levels, but as long as price remains below the 50DMA, the odds favor further downside into the macro support zone at 2.52–2.35 before a higher low can be established.
Chart:
 HYPEHUSD
Is following the price structure outlined in the previous weekly report, holding the mid-term support zone and reversing to the upside. A quick shake-out below recent August lows is possible in the coming weeks, but the next break above 50 has high odds of follow-through toward the next resistance around 65+. The price action remains among the strongest in the crypto space, suggesting potential outperformance versus most other coins during the next upside phase.
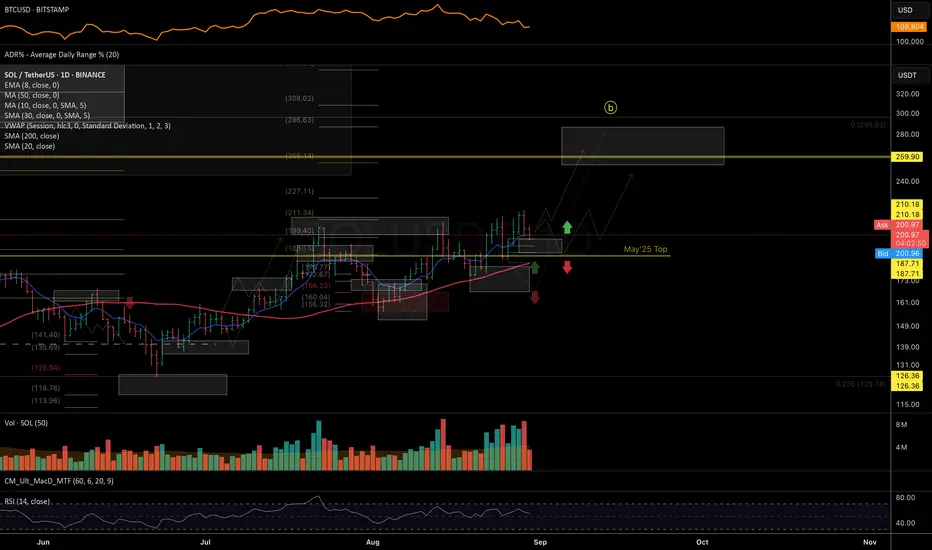
Chart: BINANCE:SOLUSDT
Is following the trend structure outlined in the previous crypto market review: holding mid-term support and continuing its upside momentum. The near-term trend looks bullish, supported by a high-level constructive consolidation. Given seasonality, a more prolonged autumn consolidation with a series of higher lows would be constructive for a more sustainable breakout later toward year-end.
Chart: https://www.tradingview.com/x/fPiJHVJ6/
BINANCE:LINKUSDT
Is following the trend structure suggested in previous August updates. I expect a more prolonged Autumn consolidation and base building within the higher levels of macro support: 19.5–17.5, before the next upside leg. The macro trend structure remains bullish and has a wide margin of safety, indicating potential outperformance during the next upward momentum.
Chart: https://www.tradingview.com/x/gPVbgA1c/
BINANCE:LTCUSDT
Price respected the mid-term resistance levels outlined in the previous August update. Mid-term support for the impulsive structure is 114–105. If these levels fail to hold, or if price cannot break above the Aug 24 highs, a more prolonged consolidation within the 108–95 macro support zone is likely.
Chart: https://www.tradingview.com/x/I27JVUC4/
BINANCE:SUIUSDT
Price respected the mid-term resistance levels outlined in the previous August update and is now consolidating orderly within the mid-term support zone. Expecting a higher low to form within 3.10–2.75, continuing base formation before a potential larger-degree breakout.
Chart: https://www.tradingview.com/x/5rzHgtcy/
BYBIT:ONDOUSDT
Is showing potential for a double bottom formation in the coming sessions. However, if price fails to break above 1–1.05 on any recovery attempt, the risk of a deeper correction toward macro support at 0.80–0.75 increases.
Chart: https://www.tradingview.com/x/APrPI286/
CRYPTO:TONUSD price continues to respect the mid-term support zone at 3.25–3.00, in line with the structure outlined in the Aug 9 weekly review. As long as 3.00 holds (with potential max downside extension toward 2.82), the bias remains for a higher-low formation and eventual resumption of the broader uptrend.
Chart: https://www.tradingview.com/x/FjvPijVH/
BINANCE:RENDERUSDT
Price is consolidating within the mid-term support zone at 3.50–3.25. The macro structure remains bullish, but there is still a risk of further downside toward the 3–2.75 macro support if price fails to reclaim the 50DMA on any recovery attempt.
Chart: https://www.tradingview.com/x/lmxNPlgJ/
BINANCE:UNIUSDT is following the larger-degree structure outlined in the previous August update. Key mid-term support for the impulsive structure lies at 9.70–8.80. If price fails to close above the August 22 highs or breaks below 8.80, the odds increase for a more complex corrective structure and extended consolidation.
Chart: https://www.tradingview.com/x/YUXcqOsE/
BINANCE:DOGEUSDT
0.22–0.20 marks a key mid-term support zone where price could form a higher low before continuing upside momentum. Failure to reclaim August highs on any breakout attempt may lead to continued selling pressure toward macro support below early August lows.
Chart: https://www.tradingview.com/x/oDApJyg3/
BINANCE:TAOUSDT is evolving within a complex corrective structure. Key macro support levels are at 287–270–250. Any short-term bounce that fails to close above the 50DMA may face renewed selling pressure toward the macro support zone.
Chart: https://www.tradingview.com/x/fqRUPVtH/
BINANCE:FETUSDT
Was unable to close above the local resistance zone highlighted in the previous August update and continues showing downside potential. Price may attempt to form a double bottom with early August lows, followed by a bounce toward the declining 50DMA. Macro support remains at 0.50–0.45. The weekly structure stays bullish for the long term, as long as price holds above April lows.
Daily chart: https://www.tradingview.com/x/l849MCzo/
Weekly chart: https://www.tradingview.com/x/2Wa2Z8E6/
BINANCE:VIRTUALUSDT.P
Is trading within the macro support zone 1.30–0.95–0.80, following the larger-degree corrective structure first suggested in July. I am looking for price to start forming a higher low within this range.
Chart: https://www.tradingview.com/x/GxP1nPMn/
BYBIT:POPCATUSDT is forming a complex corrective structure. Key macro support for a potential larger-degree higher low sits at 0.23–0.19.
Chart: https://www.tradingview.com/x/xYLe5rr2/
$1000FLOKIUSDT key support zone to maintain macro bullish structure stands at 0.097–0.085–0.075. Holding above these levels keeps odds in favor of long-term upside continuation.
Chart: https://www.tradingview.com/x/wYbYqFQe/
BINANCE:SUPERUSDT is approaching the mid-term support area at 0.53–0.50. This zone may provide conditions for a higher-low formation and potential trend continuation.
Chart: https://www.tradingview.com/x/YhW2JN1q/
$1000000MOGUSDT.P corrective structure remains complex, but as long as price holds within the mid-term support zone at 0.89–0.77–0.70, the odds favor a potential upside reversal with a new base formation developing.
Chart: https://www.tradingview.com/x/womrci7o/
CRYPTO:BRETT2USD is consolidating within the mid-term support zone highlighted since the Aug 9 weekly review. Watching for a higher-low formation inside 0.044–0.038 support before potential trend continuation.
Chart: https://www.tradingview.com/x/leHTkul8/
BINANCE:BONKUSDT price is in a mid-term support zone where a higher low formation could develop, setting up at least a bounce. A break below 0.0000183 would open the door to the next support levels at 0.0000165–0.0000145.
Chart: https://www.tradingview.com/x/i3IUC4ym/
Pulled back to the local support highlighted earlier this week. I would prefer to see a more prolonged consolidation before the next higher low forms and one more break-out into the macro resistance zone at 930–1000. However, a sustained break above Thursday’s high would increase the odds of more immediate upside momentum, potentially bypassing the longer consolidation phase.
Chart:
Is following the corrective structure outlined in the previous weekly report. A double bottom formation is possible at current levels, but as long as price remains below the 50DMA, the odds favor further downside into the macro support zone at 2.52–2.35 before a higher low can be established.
Chart:
Is following the price structure outlined in the previous weekly report, holding the mid-term support zone and reversing to the upside. A quick shake-out below recent August lows is possible in the coming weeks, but the next break above 50 has high odds of follow-through toward the next resistance around 65+. The price action remains among the strongest in the crypto space, suggesting potential outperformance versus most other coins during the next upside phase.
Chart:
Is following the trend structure outlined in the previous crypto market review: holding mid-term support and continuing its upside momentum. The near-term trend looks bullish, supported by a high-level constructive consolidation. Given seasonality, a more prolonged autumn consolidation with a series of higher lows would be constructive for a more sustainable breakout later toward year-end.
Chart: https://www.tradingview.com/x/fPiJHVJ6/
BINANCE:LINKUSDT
Is following the trend structure suggested in previous August updates. I expect a more prolonged Autumn consolidation and base building within the higher levels of macro support: 19.5–17.5, before the next upside leg. The macro trend structure remains bullish and has a wide margin of safety, indicating potential outperformance during the next upward momentum.
Chart: https://www.tradingview.com/x/gPVbgA1c/
BINANCE:LTCUSDT
Price respected the mid-term resistance levels outlined in the previous August update. Mid-term support for the impulsive structure is 114–105. If these levels fail to hold, or if price cannot break above the Aug 24 highs, a more prolonged consolidation within the 108–95 macro support zone is likely.
Chart: https://www.tradingview.com/x/I27JVUC4/
BINANCE:SUIUSDT
Price respected the mid-term resistance levels outlined in the previous August update and is now consolidating orderly within the mid-term support zone. Expecting a higher low to form within 3.10–2.75, continuing base formation before a potential larger-degree breakout.
Chart: https://www.tradingview.com/x/5rzHgtcy/
BYBIT:ONDOUSDT
Is showing potential for a double bottom formation in the coming sessions. However, if price fails to break above 1–1.05 on any recovery attempt, the risk of a deeper correction toward macro support at 0.80–0.75 increases.
Chart: https://www.tradingview.com/x/APrPI286/
CRYPTO:TONUSD price continues to respect the mid-term support zone at 3.25–3.00, in line with the structure outlined in the Aug 9 weekly review. As long as 3.00 holds (with potential max downside extension toward 2.82), the bias remains for a higher-low formation and eventual resumption of the broader uptrend.
Chart: https://www.tradingview.com/x/FjvPijVH/
BINANCE:RENDERUSDT
Price is consolidating within the mid-term support zone at 3.50–3.25. The macro structure remains bullish, but there is still a risk of further downside toward the 3–2.75 macro support if price fails to reclaim the 50DMA on any recovery attempt.
Chart: https://www.tradingview.com/x/lmxNPlgJ/
BINANCE:UNIUSDT is following the larger-degree structure outlined in the previous August update. Key mid-term support for the impulsive structure lies at 9.70–8.80. If price fails to close above the August 22 highs or breaks below 8.80, the odds increase for a more complex corrective structure and extended consolidation.
Chart: https://www.tradingview.com/x/YUXcqOsE/
BINANCE:DOGEUSDT
0.22–0.20 marks a key mid-term support zone where price could form a higher low before continuing upside momentum. Failure to reclaim August highs on any breakout attempt may lead to continued selling pressure toward macro support below early August lows.
Chart: https://www.tradingview.com/x/oDApJyg3/
BINANCE:TAOUSDT is evolving within a complex corrective structure. Key macro support levels are at 287–270–250. Any short-term bounce that fails to close above the 50DMA may face renewed selling pressure toward the macro support zone.
Chart: https://www.tradingview.com/x/fqRUPVtH/
BINANCE:FETUSDT
Was unable to close above the local resistance zone highlighted in the previous August update and continues showing downside potential. Price may attempt to form a double bottom with early August lows, followed by a bounce toward the declining 50DMA. Macro support remains at 0.50–0.45. The weekly structure stays bullish for the long term, as long as price holds above April lows.
Daily chart: https://www.tradingview.com/x/l849MCzo/
Weekly chart: https://www.tradingview.com/x/2Wa2Z8E6/
BINANCE:VIRTUALUSDT.P
Is trading within the macro support zone 1.30–0.95–0.80, following the larger-degree corrective structure first suggested in July. I am looking for price to start forming a higher low within this range.
Chart: https://www.tradingview.com/x/GxP1nPMn/
BYBIT:POPCATUSDT is forming a complex corrective structure. Key macro support for a potential larger-degree higher low sits at 0.23–0.19.
Chart: https://www.tradingview.com/x/xYLe5rr2/
$1000FLOKIUSDT key support zone to maintain macro bullish structure stands at 0.097–0.085–0.075. Holding above these levels keeps odds in favor of long-term upside continuation.
Chart: https://www.tradingview.com/x/wYbYqFQe/
BINANCE:SUPERUSDT is approaching the mid-term support area at 0.53–0.50. This zone may provide conditions for a higher-low formation and potential trend continuation.
Chart: https://www.tradingview.com/x/YhW2JN1q/
$1000000MOGUSDT.P corrective structure remains complex, but as long as price holds within the mid-term support zone at 0.89–0.77–0.70, the odds favor a potential upside reversal with a new base formation developing.
Chart: https://www.tradingview.com/x/womrci7o/
CRYPTO:BRETT2USD is consolidating within the mid-term support zone highlighted since the Aug 9 weekly review. Watching for a higher-low formation inside 0.044–0.038 support before potential trend continuation.
Chart: https://www.tradingview.com/x/leHTkul8/
BINANCE:BONKUSDT price is in a mid-term support zone where a higher low formation could develop, setting up at least a bounce. A break below 0.0000183 would open the door to the next support levels at 0.0000165–0.0000145.
Chart: https://www.tradingview.com/x/i3IUC4ym/
액티브 트레이드
Charts were not posted correctly: Is following the trend structure outlined in the previous crypto market review: holding mid-term support and continuing its upside momentum. The near-term trend looks bullish, supported by a high-level constructive consolidation. Given seasonality, a more prolonged autumn consolidation with a series of higher lows would be constructive for a more sustainable breakout later toward year-end.
Chart:
Is following the trend structure suggested in previous August updates. I expect a more prolonged Autumn consolidation and base building within the higher levels of macro support: 19.5–17.5, before the next upside leg. The macro trend structure remains bullish and has a wide margin of safety, indicating potential outperformance during the next upward momentum.
Chart:
Price respected the mid-term resistance levels outlined in the previous August update. Mid-term support for the impulsive structure is 114–105. If these levels fail to hold, or if price cannot break above the Aug 24 highs, a more prolonged consolidation within the 108–95 macro support zone is likely.
Chart:
Price respected the mid-term resistance levels outlined in the previous August update and is now consolidating orderly within the mid-term support zone. Expecting a higher low to form within 3.10–2.75, continuing base formation before a potential larger-degree breakout.
Chart:
Is showing potential for a double bottom formation in the coming sessions. However, if price fails to break above 1–1.05 on any recovery attempt, the risk of a deeper correction toward macro support at 0.80–0.75 increases.
Chart:
Chart:
Price is consolidating within the mid-term support zone at 3.50–3.25. The macro structure remains bullish, but there is still a risk of further downside toward the 3–2.75 macro support if price fails to reclaim the 50DMA on any recovery attempt.
Chart:
Chart:
0.22–0.20 marks a key mid-term support zone where price could form a higher low before continuing upside momentum. Failure to reclaim August highs on any breakout attempt may lead to continued selling pressure toward macro support below early August lows.
Chart:
Chart:
Was unable to close above the local resistance zone highlighted in the previous August update and continues showing downside potential. Price may attempt to form a double bottom with early August lows, followed by a bounce toward the declining 50DMA. Macro support remains at 0.50–0.45. The weekly structure stays bullish for the long term, as long as price holds above April lows.
Daily chart:
Weekly chart:
Is trading within the macro support zone 1.30–0.95–0.80, following the larger-degree corrective structure first suggested in July. I am looking for price to start forming a higher low within this range.
Chart:
Chart:
$1000FLOKIUSDT key support zone to maintain macro bullish structure stands at 0.097–0.085–0.075. Holding above these levels keeps odds in favor of long-term upside continuation.
Chart:
Chart:
$1000000MOGUSDT.P corrective structure remains complex, but as long as price holds within the mid-term support zone at 0.89–0.77–0.70, the odds favor a potential upside reversal with a new base formation developing.
Chart:
Chart:
Chart:
📊 Daily FREE Market Insights | Crypto + US Stocks
⚡ Technical analysis, setups & commentary
🌍 t.me/MarketArtistryENG | 🇷🇺 t.me/marketartistry
Join and let's grow together! 🚀
⚡ Technical analysis, setups & commentary
🌍 t.me/MarketArtistryENG | 🇷🇺 t.me/marketartistry
Join and let's grow together! 🚀
관련 발행물
면책사항
이 정보와 게시물은 TradingView에서 제공하거나 보증하는 금융, 투자, 거래 또는 기타 유형의 조언이나 권고 사항을 의미하거나 구성하지 않습니다. 자세한 내용은 이용 약관을 참고하세요.