📊 SOL/USDT 4H – Bullish Reversal Setup 🚀
🔍 Market Structure Analysis
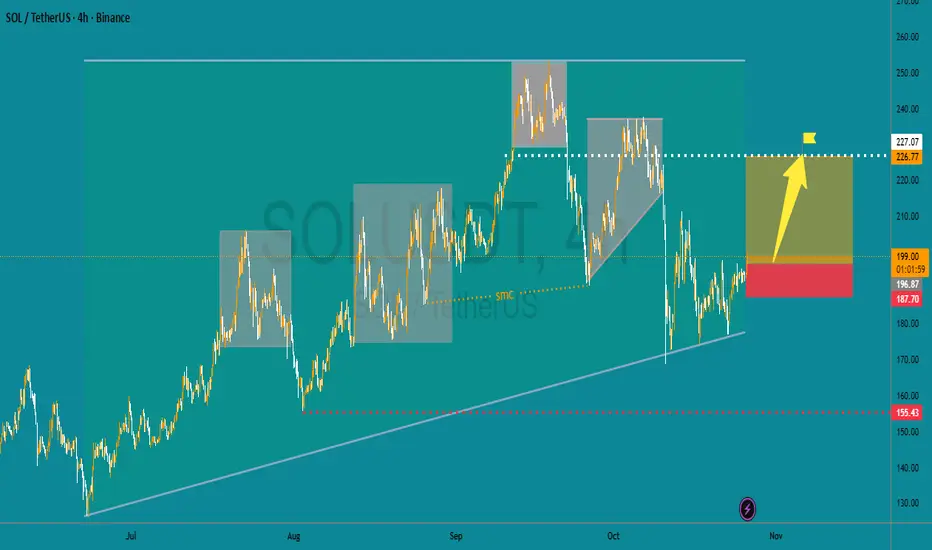
The market has shown a clear uptrend structure with higher lows (HLs) consistently forming along an ascending trendline 📈.
After a recent retracement, price respected the trendline support, signaling potential bullish continuation 🔁.
⚙️ Key Levels
Support Zone (Demand Area): 🟢 $185 – $190 → Buyers defending this region strongly.
Resistance Zone (Target Area): 🟡 $225 – $230 → Previous supply zone and structure high.
Invalidation (Stop-Loss Zone): 🔴 Below $185 → Break of structure if price drops here.
🧭 Trade Setup (as highlighted)
Entry Idea: Around $195 – $200 (current price range).
Stop-Loss: 🔻 Below $187 support.
Take Profit: 🎯 $227 zone (previous high).
Risk-to-Reward: Approximately 1:2.5, favorable for swing traders ⚖️.
💡 Market Psychology
The chart shows liquidity sweep of previous lows (liquidity grab 💧), followed by strong bullish momentum, indicating smart money accumulation (SMC concept).
The yellow arrow shows a potential break of structure (BOS) toward upside continuation.
📈 Summary
✅ Bullish momentum respected structure.
⚠️ Watch for confirmation candle close above $205–$210 before entering.
🔥 If confirmed, next bullish impulse could target $227+.
🏁 Conclusion: “Buy the Reversal, Ride the Trend” 🚀
Bias: Bullish 🟢
Strategy: Trend continuation after correction
Confidence: High if price holds above $190
🔍 Market Structure Analysis
The market has shown a clear uptrend structure with higher lows (HLs) consistently forming along an ascending trendline 📈.
After a recent retracement, price respected the trendline support, signaling potential bullish continuation 🔁.
⚙️ Key Levels
Support Zone (Demand Area): 🟢 $185 – $190 → Buyers defending this region strongly.
Resistance Zone (Target Area): 🟡 $225 – $230 → Previous supply zone and structure high.
Invalidation (Stop-Loss Zone): 🔴 Below $185 → Break of structure if price drops here.
🧭 Trade Setup (as highlighted)
Entry Idea: Around $195 – $200 (current price range).
Stop-Loss: 🔻 Below $187 support.
Take Profit: 🎯 $227 zone (previous high).
Risk-to-Reward: Approximately 1:2.5, favorable for swing traders ⚖️.
💡 Market Psychology
The chart shows liquidity sweep of previous lows (liquidity grab 💧), followed by strong bullish momentum, indicating smart money accumulation (SMC concept).
The yellow arrow shows a potential break of structure (BOS) toward upside continuation.
📈 Summary
✅ Bullish momentum respected structure.
⚠️ Watch for confirmation candle close above $205–$210 before entering.
🔥 If confirmed, next bullish impulse could target $227+.
🏁 Conclusion: “Buy the Reversal, Ride the Trend” 🚀
Bias: Bullish 🟢
Strategy: Trend continuation after correction
Confidence: High if price holds above $190
Join My Telegram Channel Link 👇
t.me/honeyspottrading
Join My Refferel Broker Link 👇
one.exnessonelink.com/a/uvd1etcgg1
Refferel code 👇
uvd1etcgg1
t.me/honeyspottrading
Join My Refferel Broker Link 👇
one.exnessonelink.com/a/uvd1etcgg1
Refferel code 👇
uvd1etcgg1
관련 발행물
면책사항
이 정보와 게시물은 TradingView에서 제공하거나 보증하는 금융, 투자, 거래 또는 기타 유형의 조언이나 권고 사항을 의미하거나 구성하지 않습니다. 자세한 내용은 이용 약관을 참고하세요.