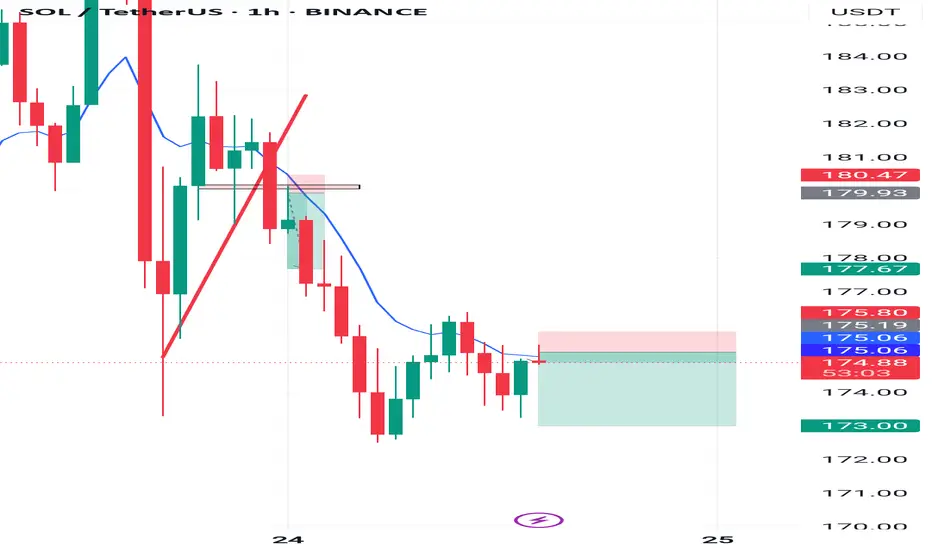
This is a 1-hour chart of SOL/USDT (Solana vs Tether) on TradingView. Here's a breakdown of the technical analysis visible:
Trade Setup Overview:
Current Price: ~$175.05
Entry Point: Around 175.09 (marked by blue horizontal line and entry candle)
Stop Loss (SL): Around 175.80 (red zone above the entry)
Take Profit (TP): Around 173.00 (green zone below the entry)
Chart Analysis:
1. Trend:
Recent price action shows a strong downward trend, with consecutive bearish candles.
Price tried to break above the 9-period EMA (blue line), but it's acting as dynamic resistance.
2. Entry Logic:
The trade is a short/sell position.
Entry was likely made after a bearish rejection from the EMA or minor structure resistance.
Trader expects price to drop further towards the 173.00 level.
3. Risk-to-Reward Ratio (RRR):
SL is small (~0.7 points above), TP is large (~2 points below), suggesting a good RRR (approx. 1:3).
That’s a positive sign for proper risk management.
4. Bearish Confirmation:
The green candle that hit the EMA and then showed weakness might be a signal of rejection, confirming bearish sentiment continuation.
5. Key Levels:
Resistance: 175.80 – 177.67 zone
Support: 173.00 zone (target)
면책사항
이 정보와 게시물은 TradingView에서 제공하거나 보증하는 금융, 투자, 거래 또는 기타 유형의 조언이나 권고 사항을 의미하거나 구성하지 않습니다. 자세한 내용은 이용 약관을 참고하세요.
면책사항
이 정보와 게시물은 TradingView에서 제공하거나 보증하는 금융, 투자, 거래 또는 기타 유형의 조언이나 권고 사항을 의미하거나 구성하지 않습니다. 자세한 내용은 이용 약관을 참고하세요.