We see this bullish novel on the 1D timeframe, which is a strong formation in this kind of trend.
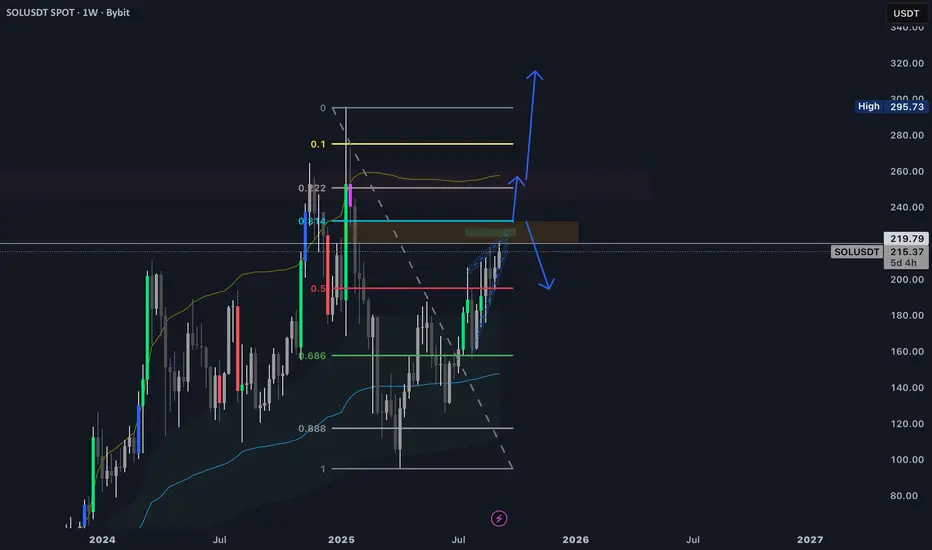
Next, one of the most important Fibonacci levels in my opinion is 0.314, which is closing our volume gap (visible more clearly on the 1W timeframe). These two confluences, plus the divergence seen from the 1D TF downward, make me think of a possible slight downtrend from the 223–229 area, with potential liquidity grabs up to 232. In that case, we could be back at 193 and then continue the ride toward a new ATH.
One thing we need to keep in mind (but just as a possibility) is the Head & Shoulders formation from March 2024, with the head at the ATH and a potential right shoulder forming right now. It’s a darker scenario, but we shouldn’t forget about it.
So, I remain bearish until we break above $240.
Let’s see what the market gives us.
면책사항
이 정보와 게시물은 TradingView에서 제공하거나 보증하는 금융, 투자, 거래 또는 기타 유형의 조언이나 권고 사항을 의미하거나 구성하지 않습니다. 자세한 내용은 이용 약관을 참고하세요.
면책사항
이 정보와 게시물은 TradingView에서 제공하거나 보증하는 금융, 투자, 거래 또는 기타 유형의 조언이나 권고 사항을 의미하거나 구성하지 않습니다. 자세한 내용은 이용 약관을 참고하세요.