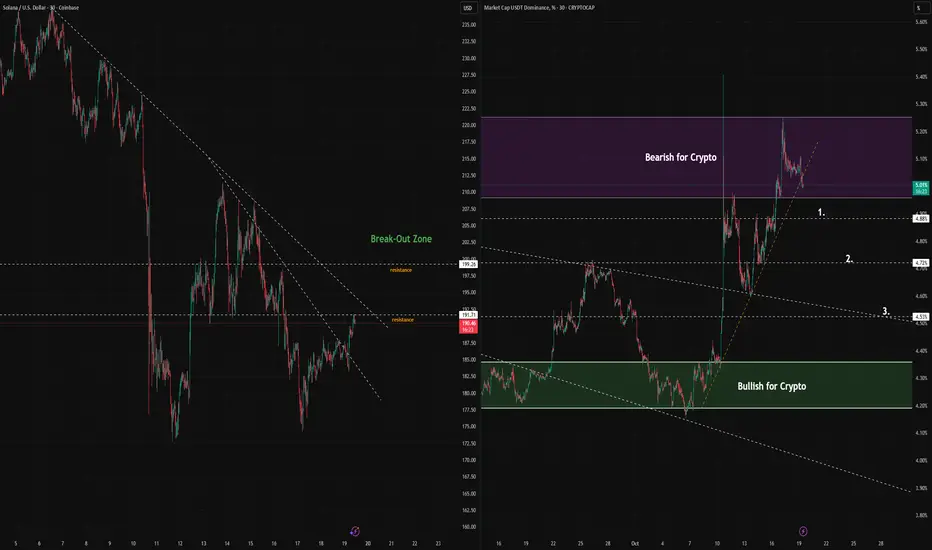
Solana has been in a downward trend since October 6th, but we are seeing some hints at a reversal. This is not yet confirmed, and weekend price action tends to be a poor indicator of the week ahead. This chart tries to plot the key levels that SOL/USD needs to break through in order to show strong bullish momentum going into the end of October.
The levels to watch are $192, as the first resistance. And if Solana can break above that, it needs to smash through the $200 level. If that were to play out, keep in mind that $205 has frequently been a key support/resistance level as well. A break above $200 may stall at the $205 level for a while, and bulls will need to see it stay above $200.
The USDT.D chart is an important indicator of the allocation of capital into, or out of crypto. Traders should watch for a drop in USDT dominance to confirm that there is ample liquidity to maintain a Solana rally. The key levels to watch for is a USDT.D break below 4.88% (1), 4.72% (2), and 4.53% (3). With each break of these support levels, we should see bullish momentum in the broader crypto market, which could translate into a Solana rally.
Keep in mind that Solana, while hinting at a run for $192 this morning, could find strong resistance there. Whatever plays out today, its still a weekend, which means you should look for further confirmation into the trading week ahead. Aggressive traders may want to take positions here before SOL breaks these key levels, but this carries considerable risk that the downward trend line continues to be resistance. If that proves to be the case, watch for the next support to be around $175.
See my YouTube channel for videos explaining some of the strategies that I post.
면책사항
해당 정보와 게시물은 금융, 투자, 트레이딩 또는 기타 유형의 조언이나 권장 사항으로 간주되지 않으며, 트레이딩뷰에서 제공하거나 보증하는 것이 아닙니다. 자세한 내용은 이용 약관을 참조하세요.
See my YouTube channel for videos explaining some of the strategies that I post.
면책사항
해당 정보와 게시물은 금융, 투자, 트레이딩 또는 기타 유형의 조언이나 권장 사항으로 간주되지 않으며, 트레이딩뷰에서 제공하거나 보증하는 것이 아닙니다. 자세한 내용은 이용 약관을 참조하세요.