Technical structure and patterns
On the daily chart, SOL has formed an inverse head and shoulders pattern, a classic reversal pattern. A breakout above the neckline with increasing volume could lead to a move to $247.71. However, weak demand could jeopardize this scenario, triggering a fall even to $138.05.
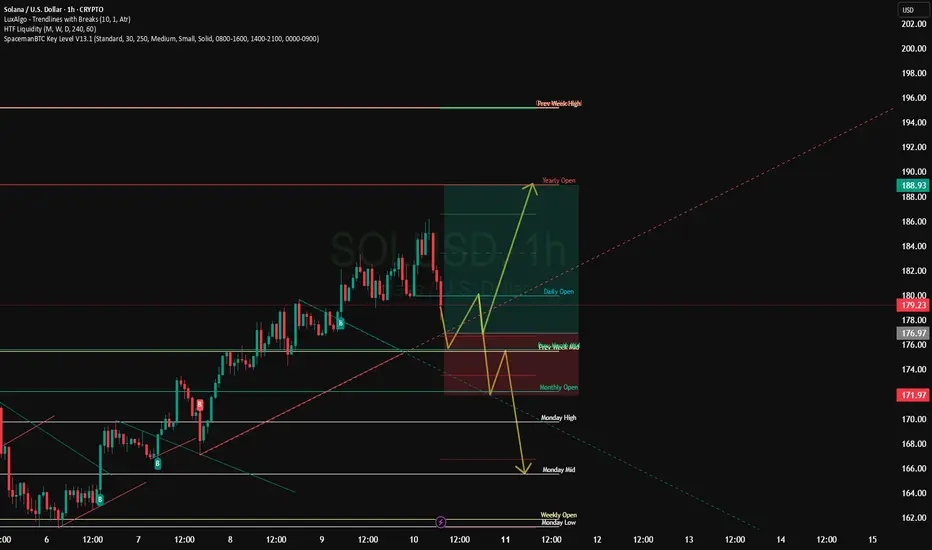
The asset has grown by 18% in a week, reaching $181, but there are liquidation clusters and strong resistance at $184–185. A breakout of this range could accelerate growth, with a possible surge to $256.
Support and resistance levels
Resistance:
The key zone is $180–184, a breakout of which would open the way to growth.
Support:
Important zones are $153–143, where cumulative activity was previously observed.
Network background and volume dynamics
The number of tokens on exchanges has decreased by almost 10%, which indicates a decrease in selling pressure. A "golden cross" is also forming between the 100- and 200-day EMAs - a bullish signal with target levels above $176.
Earlier, SOL rebounded from the support zone around $160 and is moving towards a breakout of $175. The further trajectory - growth or consolidation - will depend on how the price behaves at the border around $175.
On the daily chart, SOL has formed an inverse head and shoulders pattern, a classic reversal pattern. A breakout above the neckline with increasing volume could lead to a move to $247.71. However, weak demand could jeopardize this scenario, triggering a fall even to $138.05.
The asset has grown by 18% in a week, reaching $181, but there are liquidation clusters and strong resistance at $184–185. A breakout of this range could accelerate growth, with a possible surge to $256.
Support and resistance levels
Resistance:
The key zone is $180–184, a breakout of which would open the way to growth.
Support:
Important zones are $153–143, where cumulative activity was previously observed.
Network background and volume dynamics
The number of tokens on exchanges has decreased by almost 10%, which indicates a decrease in selling pressure. A "golden cross" is also forming between the 100- and 200-day EMAs - a bullish signal with target levels above $176.
Earlier, SOL rebounded from the support zone around $160 and is moving towards a breakout of $175. The further trajectory - growth or consolidation - will depend on how the price behaves at the border around $175.
거래청산: 타겟 닿음
TP 1노트
Take Profit 2관련 발행물
면책사항
이 정보와 게시물은 TradingView에서 제공하거나 보증하는 금융, 투자, 거래 또는 기타 유형의 조언이나 권고 사항을 의미하거나 구성하지 않습니다. 자세한 내용은 이용 약관을 참고하세요.
관련 발행물
면책사항
이 정보와 게시물은 TradingView에서 제공하거나 보증하는 금융, 투자, 거래 또는 기타 유형의 조언이나 권고 사항을 의미하거나 구성하지 않습니다. 자세한 내용은 이용 약관을 참고하세요.