In the crypto space we time and again regularly focus on the  BTC and the BTC.D chart and we have time and again predicted that BTC.D will touch at least 66% in this Crypto cycle. This BTC Dominance can be interpreted not only as the BTC superiority but the weakness of Altcoins. Most of it comes from the big caps like
  ETH and $SOL.
On June 23 we wrote about theETHBTC failed breakout, and we put forward the case why the chart looks bearish.
ETHBTC failed multiyear breakout. for BINANCE:ETHBTC by RabishankarBiswal
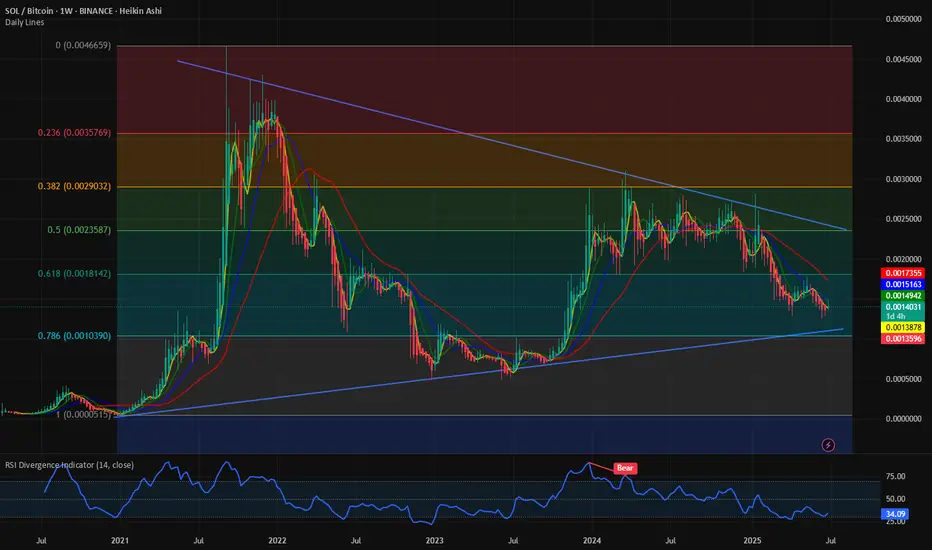
The second largest Altcoin SOL is also not showing any strengths either. The SOLBTC chart is still range bound within the 0.618 and 0.786 Fib retracement levels. It has failed to break out of this channel, and it is boxed within the downward sloping wedge which also is not bullish for the crypto pair. The best case is SOLBTC sweeps the 0.5 Fib levels at the highs and 0.786 at the lows. That means SOLBTC valuation will be 0.0025 at its upper range and 0.001125 at its lower bound.
Verdict:SOLBTC range bound between 0.0025 to 0.00125 with downward bias.
On June 23 we wrote about the
The second largest Altcoin
Verdict:
관련 발행물
면책사항
해당 정보와 게시물은 금융, 투자, 트레이딩 또는 기타 유형의 조언이나 권장 사항으로 간주되지 않으며, 트레이딩뷰에서 제공하거나 보증하는 것이 아닙니다. 자세한 내용은 이용 약관을 참조하세요.
관련 발행물
면책사항
해당 정보와 게시물은 금융, 투자, 트레이딩 또는 기타 유형의 조언이나 권장 사항으로 간주되지 않으며, 트레이딩뷰에서 제공하거나 보증하는 것이 아닙니다. 자세한 내용은 이용 약관을 참조하세요.