I’m extremely bullish on SoFi long-term, but the chart is signaling a potential pullback opportunity before the next leg up.
🔹 Technical Breakdown:
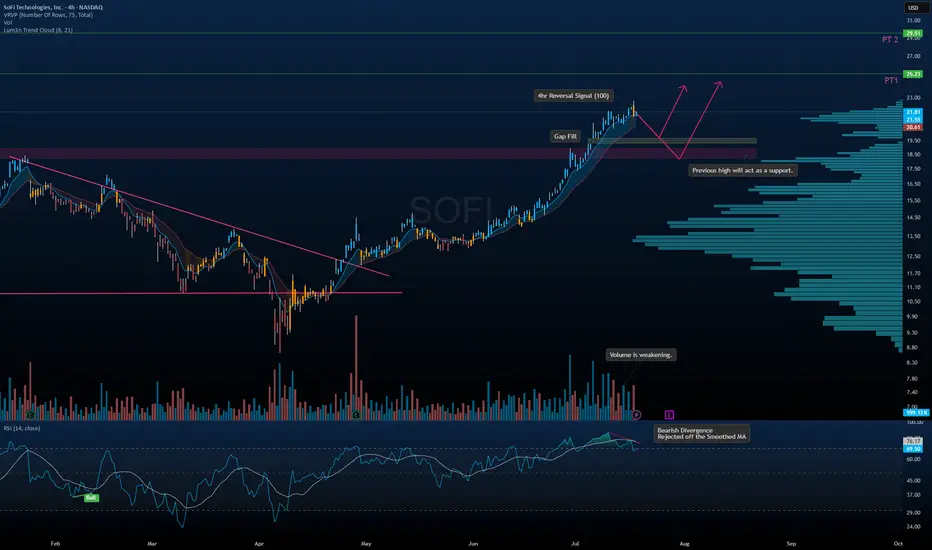
• Bearish Divergence on RSI with rejection off the smoothed MA
• Volume weakening as price moves higher – classic sign of exhaustion
• 4hr Reversal Signal flashing near local highs
• Gap Fill zone near $19.50 + previous highs = strong support zone
• Lum3n Trend Cloud still bullish — trend intact unless breakdown occurs
🎯 Targets:
• PT1 → $23.25
• PT2 → $29.50 (longer-term structure extension)
🧠 Thesis:
Letting price come to us is the smarter move here. I’m watching the $19.50–$20.00 zone closely for potential accumulation. That level has strong confluence with volume shelf, support, and fib structure.
🔹 Technical Breakdown:
• Bearish Divergence on RSI with rejection off the smoothed MA
• Volume weakening as price moves higher – classic sign of exhaustion
• 4hr Reversal Signal flashing near local highs
• Gap Fill zone near $19.50 + previous highs = strong support zone
• Lum3n Trend Cloud still bullish — trend intact unless breakdown occurs
🎯 Targets:
• PT1 → $23.25
• PT2 → $29.50 (longer-term structure extension)
🧠 Thesis:
Letting price come to us is the smarter move here. I’m watching the $19.50–$20.00 zone closely for potential accumulation. That level has strong confluence with volume shelf, support, and fib structure.
면책사항
이 정보와 게시물은 TradingView에서 제공하거나 보증하는 금융, 투자, 거래 또는 기타 유형의 조언이나 권고 사항을 의미하거나 구성하지 않습니다. 자세한 내용은 이용 약관을 참고하세요.
면책사항
이 정보와 게시물은 TradingView에서 제공하거나 보증하는 금융, 투자, 거래 또는 기타 유형의 조언이나 권고 사항을 의미하거나 구성하지 않습니다. 자세한 내용은 이용 약관을 참고하세요.