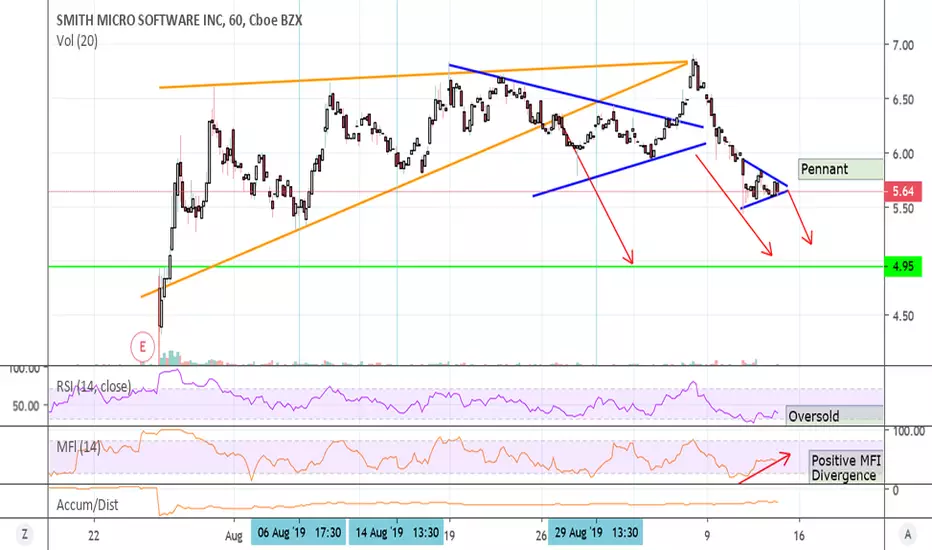
Hourly indicators are actually bullish, but 3 separate chart patterns indicate a target of $5. Pattern is very similar to the 2015 rally, if the market keeps selling of software companies, this could hit gap support between $4.5 - 4.75.
Long term, everything depends on earnings.... I'm still bullish, waiting for the pullback.
Long term, everything depends on earnings.... I'm still bullish, waiting for the pullback.
노트
Positive MFI divergence on the 2 hr chart now, but boy does it look bad on the daily chart. I think waiting for this to go oversold on the daily is the wise move.Software sector getting hammered, looks like the whole sector is due for one more day of tanking. Will probably be weak for the entire week, will look at this Thu/Fri.
노트
I had a bid in at my $5 target and it barely missed. There might be a quick flip possible here as it's still oversold with positive divergence in every intraday chart timeframe. (Still not oversold on the daily though.)I was taking care of my other trades, and didn't up my bid, oh well.
면책사항
해당 정보와 게시물은 금융, 투자, 트레이딩 또는 기타 유형의 조언이나 권장 사항으로 간주되지 않으며, 트레이딩뷰에서 제공하거나 보증하는 것이 아닙니다. 자세한 내용은 이용 약관을 참조하세요.
면책사항
해당 정보와 게시물은 금융, 투자, 트레이딩 또는 기타 유형의 조언이나 권장 사항으로 간주되지 않으며, 트레이딩뷰에서 제공하거나 보증하는 것이 아닙니다. 자세한 내용은 이용 약관을 참조하세요.