First off, SMPH is a bluechip stock in PSE.
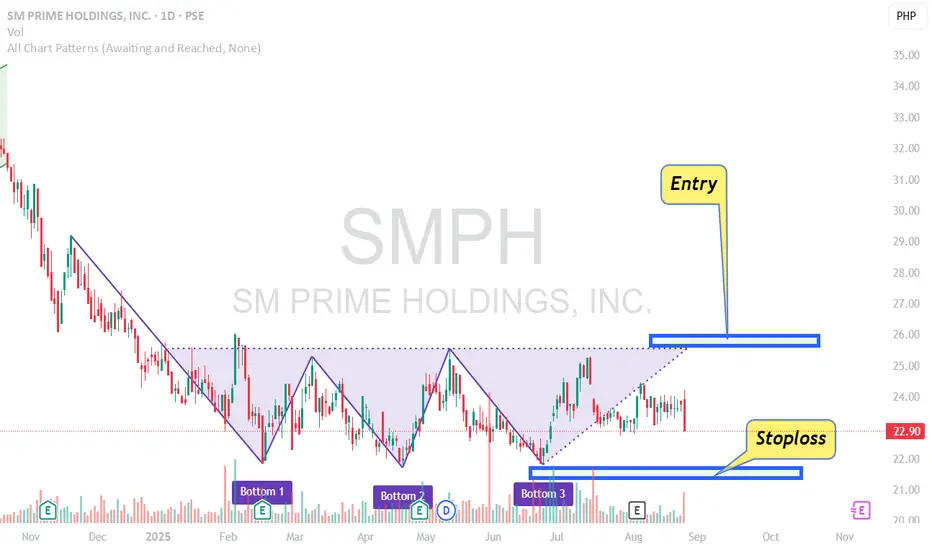
The price of SMPH made a triple bottom chart pattern. Triple bottom is a bullish reversal pattern. The entry is on the break of the neckline. You put a stoploss below the right (3rd) shoulder after entry.
Triple bottom chart pattern is a "prove me your strong by breaking out" type of pattern. Most traders confuse triple bottom as a pattern to buy near the bottom. You do not buy near the bottom on this type of pattern. You buy on breakouts. Any chart pattern can either succeed or fail. Near bottom buying is a step closer to the chart pattern failing so avoid that. Calm yourself down and wait for the breakout.
BER months is coming and that might trigger some movement on this stock.
Goodluck on your trades. Trade well.
Traders Den PH
blogs.tradersdenph.com
blogs.tradersdenph.com
면책사항
해당 정보와 게시물은 금융, 투자, 트레이딩 또는 기타 유형의 조언이나 권장 사항으로 간주되지 않으며, 트레이딩뷰에서 제공하거나 보증하는 것이 아닙니다. 자세한 내용은 이용 약관을 참조하세요.
Traders Den PH
blogs.tradersdenph.com
blogs.tradersdenph.com
면책사항
해당 정보와 게시물은 금융, 투자, 트레이딩 또는 기타 유형의 조언이나 권장 사항으로 간주되지 않으며, 트레이딩뷰에서 제공하거나 보증하는 것이 아닙니다. 자세한 내용은 이용 약관을 참조하세요.