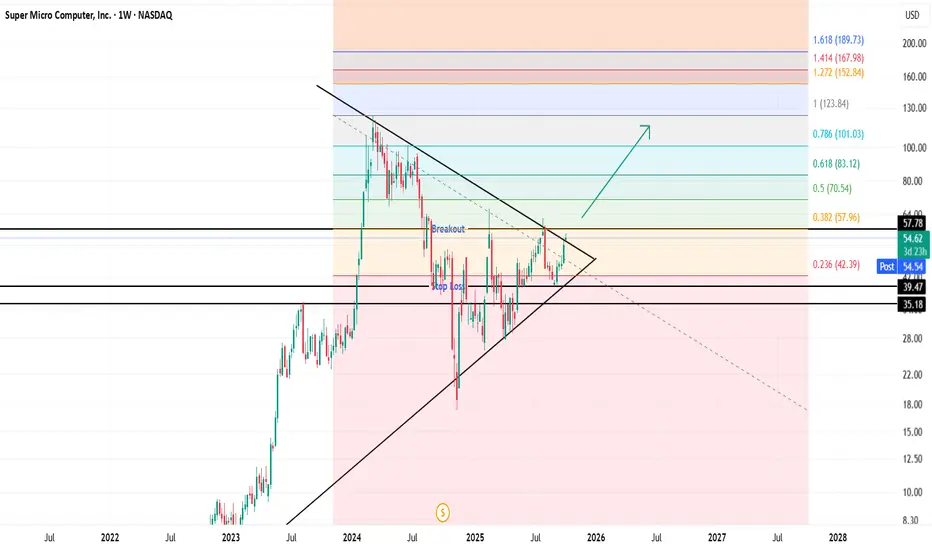
SMCI is at a major decision point. Wait for breakout confirmation above $57.78, use the triangle structure and Fibonacci extensions as your target zones, and manage risk via the marked stop levels. This technical setup combines classical charting with quantitative projections, providing a clear framework for swing traders and investors.
Key Levels and Setup
Symmetrical Triangle: Price is consolidating between converging trendlines, now nearing the apex, signaling an imminent breakout move.
Breakout Level: A sustained close above $57.78 (upper trendline/horizontal resistance) would confirm the bullish breakout.
Stop Loss: Clearly marked near the lower horizontal line (below $39.47 or $35.18) to protect against false breakouts.
면책사항
해당 정보와 게시물은 금융, 투자, 트레이딩 또는 기타 유형의 조언이나 권장 사항으로 간주되지 않으며, 트레이딩뷰에서 제공하거나 보증하는 것이 아닙니다. 자세한 내용은 이용 약관을 참조하세요.
면책사항
해당 정보와 게시물은 금융, 투자, 트레이딩 또는 기타 유형의 조언이나 권장 사항으로 간주되지 않으며, 트레이딩뷰에서 제공하거나 보증하는 것이 아닙니다. 자세한 내용은 이용 약관을 참조하세요.