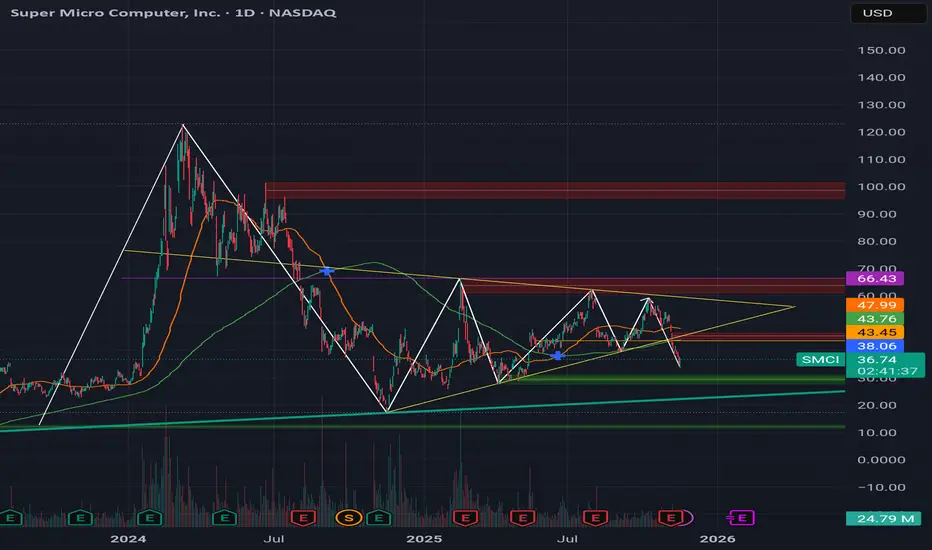
I see a HUGE symmetrical triangle pattern with a HUGE fakeout on a daily chart.
Past few years, SMCI has always been at its yearly lowest in November time frame, and then it shoots up towards the end of year. Check it out yourself.
Recent A.I. bubble fears have given us amazing discount (the huge fakeout).
I know SMCI almost always does not act accordingly to conventional analysis we anticipate and this time is no exception. If this heads lower again,- perhaps down to sub-$30(?), I am going to fully commit for Christmas present.
My target is $66 by the end of the year :)
Good luck out there, everyone.
면책사항
해당 정보와 게시물은 금융, 투자, 트레이딩 또는 기타 유형의 조언이나 권장 사항으로 간주되지 않으며, 트레이딩뷰에서 제공하거나 보증하는 것이 아닙니다. 자세한 내용은 이용 약관을 참조하세요.
면책사항
해당 정보와 게시물은 금융, 투자, 트레이딩 또는 기타 유형의 조언이나 권장 사항으로 간주되지 않으며, 트레이딩뷰에서 제공하거나 보증하는 것이 아닙니다. 자세한 내용은 이용 약관을 참조하세요.