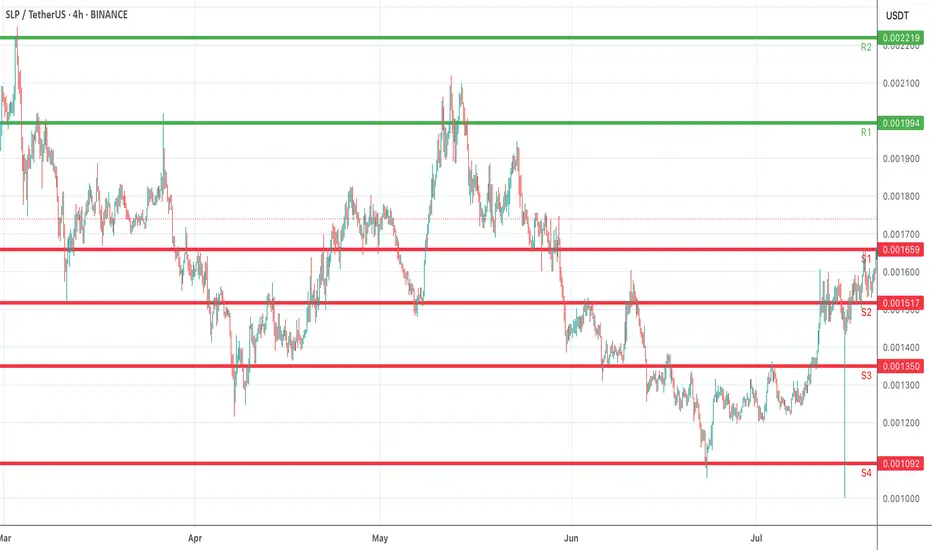
The chart highlights well-defined support and resistance levels. On the downside, S1 (0.001659) and S2 (0.001517) serve as near-term support zones where buyers may look to defend. Further downside risk could extend toward S3 (0.001350) and S4 (0.001092) if momentum weakens. On the upside, R1 (0.001994) and R2 (0.002219) act as resistance barriers, where selling pressure or profit-taking may emerge.
Trading within this range, a breakout above R1 could open the path to bullish continuation, while a breakdown below S2 may trigger extended bearish pressure. Monitoring volume and candle closes around these key zones will provide stronger confirmation for directional bias.
Trading within this range, a breakout above R1 could open the path to bullish continuation, while a breakdown below S2 may trigger extended bearish pressure. Monitoring volume and candle closes around these key zones will provide stronger confirmation for directional bias.
면책사항
이 정보와 게시물은 TradingView에서 제공하거나 보증하는 금융, 투자, 거래 또는 기타 유형의 조언이나 권고 사항을 의미하거나 구성하지 않습니다. 자세한 내용은 이용 약관을 참고하세요.
면책사항
이 정보와 게시물은 TradingView에서 제공하거나 보증하는 금융, 투자, 거래 또는 기타 유형의 조언이나 권고 사항을 의미하거나 구성하지 않습니다. 자세한 내용은 이용 약관을 참고하세요.