Visual Structure and Pattern
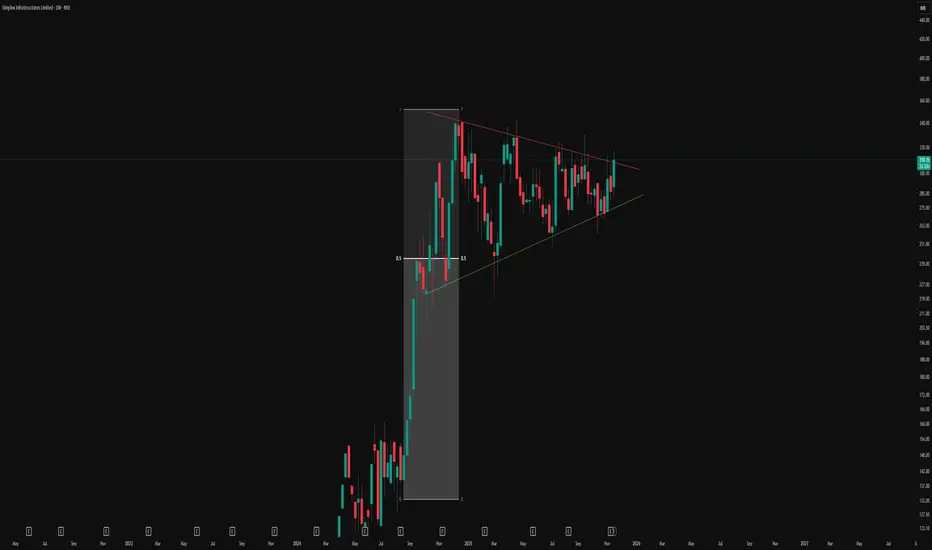
-This chart illustrates a textbook symmetrical triangle pattern forming after a strong directional move.
-The red line represents the counter trendline (CT), connecting a series of lower highs.
-The green line marks the ascending trendline, connecting the sequence of higher lows.
-These converging lines encapsulate a contracting price structure, where volatility reduces over time, emphasizing indecision and consolidation among market participants.
-Symmetrical triangles predominantly represent phases where markets consolidate after an impulsive run, and both sides (bulls and bears) gradually reach a point of agreement before the next expansion.
-The 50% equilibrium level within triangles often acts as a magnet for price, attracting liquidity and providing reference for institutional flows, a concept vital for advanced swing trading and risk management.
This post is strictly for educational and analytical purposes, focusing only on chart structures and observable patterns. No content here should be taken as an indication of future price direction or as investment advice.
🎯 Master My Self-Made Trading Strategy
📈 Telegram (Learn Today): t.me/hashtaghammer
✅ WhatsApp (Learn Today): wa.me/919455664601
📈 Telegram (Learn Today): t.me/hashtaghammer
✅ WhatsApp (Learn Today): wa.me/919455664601
관련 발행물
면책사항
해당 정보와 게시물은 금융, 투자, 트레이딩 또는 기타 유형의 조언이나 권장 사항으로 간주되지 않으며, 트레이딩뷰에서 제공하거나 보증하는 것이 아닙니다. 자세한 내용은 이용 약관을 참조하세요.