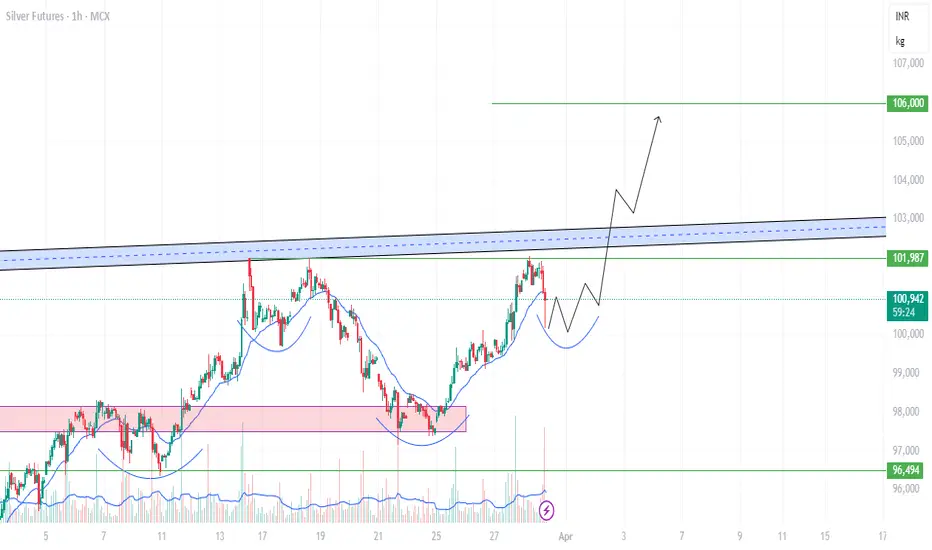
chart shows an Inverse Head and Shoulders pattern in Silver Futures on the 1-hour timeframe.
The neckline (resistance) is marked by the blue zone, which, if broken with strong volume, could confirm a bullish breakout. The projected price movement (black arrow) suggests a potential rally toward ₹106,000.
A confirmation would come if the price breaks above the ₹101,987 - ₹103,000 resistance zone with volume.
Place SL below the right shoulder (~₹100,000) for a safe trade.
면책사항
이 정보와 게시물은 TradingView에서 제공하거나 보증하는 금융, 투자, 거래 또는 기타 유형의 조언이나 권고 사항을 의미하거나 구성하지 않습니다. 자세한 내용은 이용 약관을 참고하세요.
면책사항
이 정보와 게시물은 TradingView에서 제공하거나 보증하는 금융, 투자, 거래 또는 기타 유형의 조언이나 권고 사항을 의미하거나 구성하지 않습니다. 자세한 내용은 이용 약관을 참고하세요.