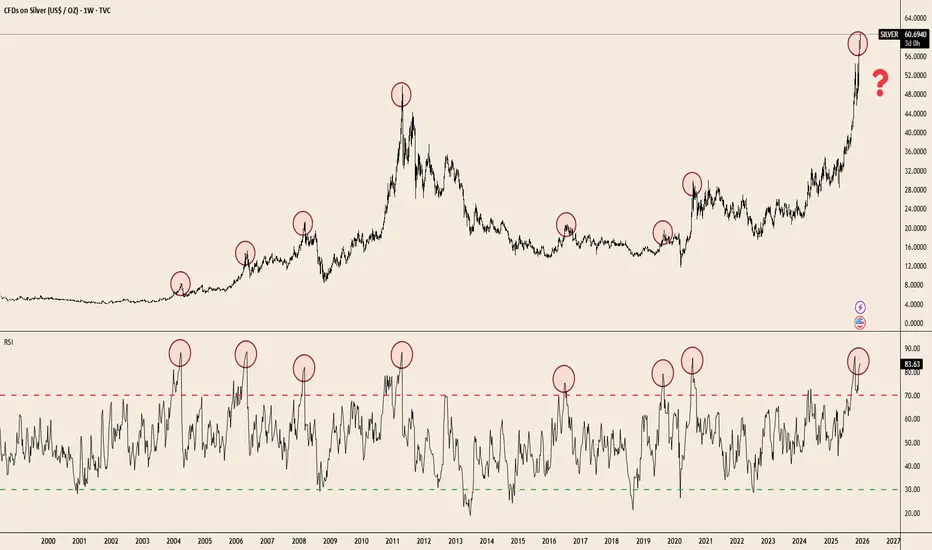
The chart makes the pattern clear:
• Each parabolic advance since 2004 ended with RSI extremes similar to today.
• Price is testing the same overextension zone seen at the 2011 blow-off top and the 2020 surge.
• Weekly RSI rarely stays above 80 for long — momentum tends to reset before the next leg can form.
This doesn’t guarantee a top.
But when a commodity doubles in a single year and hits long-term RSI ceilings simultaneously, risk/reward becomes asymmetric.
Silver’s trend remains powerful — the question now is how sustainable the slope is.
면책사항
해당 정보와 게시물은 금융, 투자, 트레이딩 또는 기타 유형의 조언이나 권장 사항으로 간주되지 않으며, 트레이딩뷰에서 제공하거나 보증하는 것이 아닙니다. 자세한 내용은 이용 약관을 참조하세요.
면책사항
해당 정보와 게시물은 금융, 투자, 트레이딩 또는 기타 유형의 조언이나 권장 사항으로 간주되지 않으며, 트레이딩뷰에서 제공하거나 보증하는 것이 아닙니다. 자세한 내용은 이용 약관을 참조하세요.