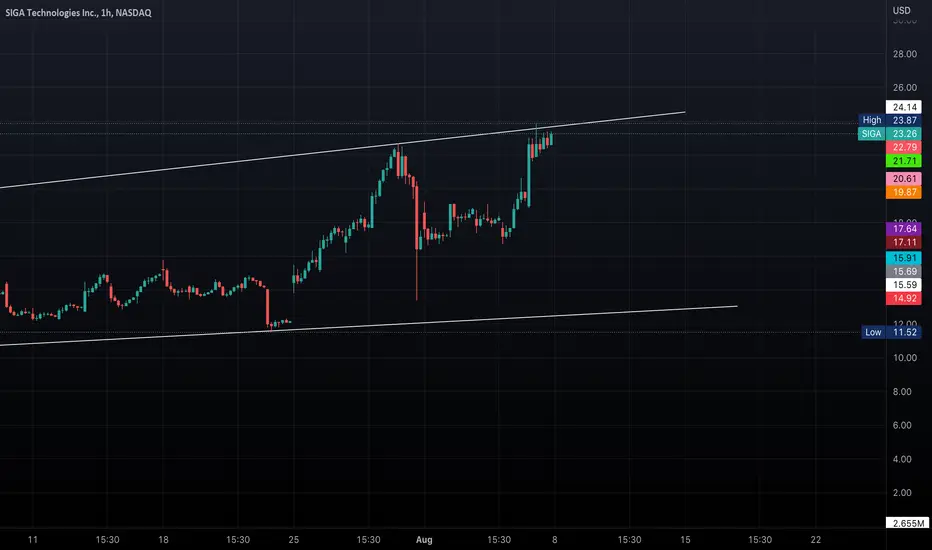
SIGA has an ascending channel pattern on the daily chart.
A closer look at SIGA shows a bull flag formation on the hourly chart.
I strongly believe that a break of the flag (on the hourly) will push SIGA above the upper trendline of the ascending channel (on the daily).
The measured potential maximum move of the bull flag is approximately 4.18 points and the measured potential maximum move of the ascending channel is approximately 15.90 points. Therefore, the combined potential maximum move approximation is 20.08 points.
Therefore, my entry will occur after price breaks and holds level 24.


*This is not financial advice.
Loved and Blessed,
MrALTrades00
A closer look at SIGA shows a bull flag formation on the hourly chart.
I strongly believe that a break of the flag (on the hourly) will push SIGA above the upper trendline of the ascending channel (on the daily).
The measured potential maximum move of the bull flag is approximately 4.18 points and the measured potential maximum move of the ascending channel is approximately 15.90 points. Therefore, the combined potential maximum move approximation is 20.08 points.
Therefore, my entry will occur after price breaks and holds level 24.
*This is not financial advice.
Loved and Blessed,
MrALTrades00
면책사항
이 정보와 게시물은 TradingView에서 제공하거나 보증하는 금융, 투자, 거래 또는 기타 유형의 조언이나 권고 사항을 의미하거나 구성하지 않습니다. 자세한 내용은 이용 약관을 참고하세요.
면책사항
이 정보와 게시물은 TradingView에서 제공하거나 보증하는 금융, 투자, 거래 또는 기타 유형의 조언이나 권고 사항을 의미하거나 구성하지 않습니다. 자세한 내용은 이용 약관을 참고하세요.