🔎 Intro / Overview
Managing risk is just as important as finding an entry. The Bullish Engulfing is one of the most effective candlestick patterns to identify potential reversals. When traded with discipline, it signals a shift from seller pressure to buyer control, helping traders time their entries with confidence.
📔 Concept
A Bullish Engulfing occurs when:
👉 This shows a clear psychological shift — sellers push lower (red candle), but buyers step in strongly (green candle) and reclaim control.
📌 How to Use
✅ Validation → The candle must close above the close of the green candle.
❌ Invalidation → If price closes below the open of the green candle before confirmation.
Trading Plan:
📊 Chart Explanation
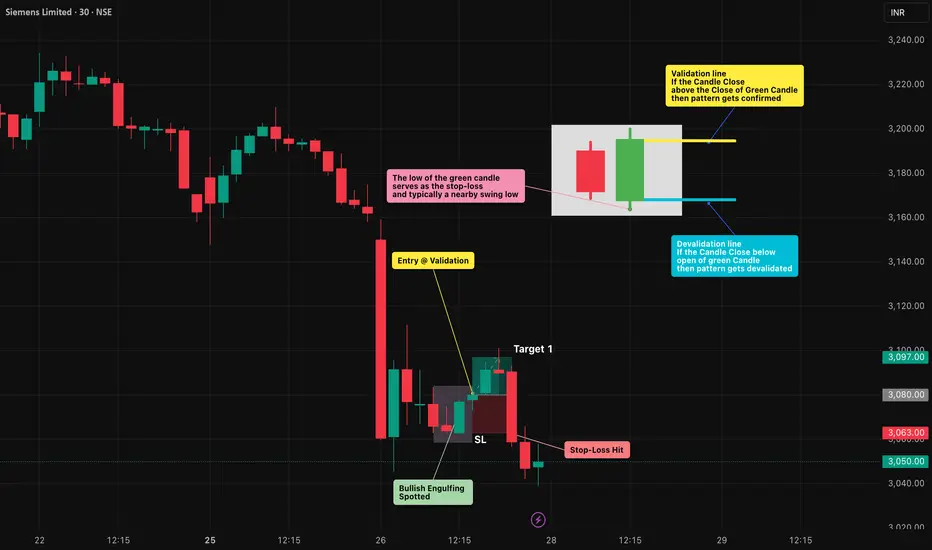
On the chart, the first small red candle shows sellers continuing the downtrend. The next large green candle completely engulfs the red candle’s body and closes higher — signaling that buyers have taken control.
The pattern was validated at the close of the green candle, where the long entry was taken. The low of the green candle is used as the stop-loss level, while the targets are mirrored in reverse using the same distance.
In this example, Stop-loss was quickly achieved. From there, traders can apply trailing stop methods to lock in profits and manage further upside targets.
👀 Observation
❗ Why It Matters?
🎯 Conclusion
The Bullish Engulfing is a strong sign of reversal — but only when combined with structure, confirmation, and disciplined risk management.
🔥 Patterns don’t predict. Rules protect.
⚠️ Disclaimer
For educational purposes only · Not SEBI registered · Not a buy/sell recommendation · No investment advice — purely a learning resource
Managing risk is just as important as finding an entry. The Bullish Engulfing is one of the most effective candlestick patterns to identify potential reversals. When traded with discipline, it signals a shift from seller pressure to buyer control, helping traders time their entries with confidence.
📔 Concept
A Bullish Engulfing occurs when:
- The first candle is a small red candle that continues the downtrend.
- The next candle is a large green candle whose body completely engulfs the red candle’s body.
👉 This shows a clear psychological shift — sellers push lower (red candle), but buyers step in strongly (green candle) and reclaim control.
📌 How to Use
✅ Validation → The candle must close above the close of the green candle.
❌ Invalidation → If price closes below the open of the green candle before confirmation.
Trading Plan:
- Entry → After confirmation of the green candle’s close.
- Stop-Loss (SL) → Below the low of the green candle.
- Take-Profit (TP):
- Conservative → 1R (Entry → SL distance)
- Moderate → 2R
- Aggressive → Book partial at 1R and trail the rest using tools like ATR, Fibonacci levels, or structure-based stops to ride any extended upside move.
- Conservative → 1R (Entry → SL distance)
📊 Chart Explanation
On the chart, the first small red candle shows sellers continuing the downtrend. The next large green candle completely engulfs the red candle’s body and closes higher — signaling that buyers have taken control.
The pattern was validated at the close of the green candle, where the long entry was taken. The low of the green candle is used as the stop-loss level, while the targets are mirrored in reverse using the same distance.
In this example, Stop-loss was quickly achieved. From there, traders can apply trailing stop methods to lock in profits and manage further upside targets.
👀 Observation
- Most effective at support zones or after a prolonged downtrend.
- A high-volume green candle adds conviction to the signal.
- In sideways/choppy markets, it can produce false signals — always filter with structure and indicators.
❗ Why It Matters?
- The red candle shows seller pressure.
- The green candle shows buyer strength.
- This clear shift in control creates a rule-based setup with defined entry, SL, and TP.
🎯 Conclusion
The Bullish Engulfing is a strong sign of reversal — but only when combined with structure, confirmation, and disciplined risk management.
🔥 Patterns don’t predict. Rules protect.
⚠️ Disclaimer
For educational purposes only · Not SEBI registered · Not a buy/sell recommendation · No investment advice — purely a learning resource
면책사항
해당 정보와 게시물은 금융, 투자, 트레이딩 또는 기타 유형의 조언이나 권장 사항으로 간주되지 않으며, 트레이딩뷰에서 제공하거나 보증하는 것이 아닙니다. 자세한 내용은 이용 약관을 참조하세요.
면책사항
해당 정보와 게시물은 금융, 투자, 트레이딩 또는 기타 유형의 조언이나 권장 사항으로 간주되지 않으며, 트레이딩뷰에서 제공하거나 보증하는 것이 아닙니다. 자세한 내용은 이용 약관을 참조하세요.