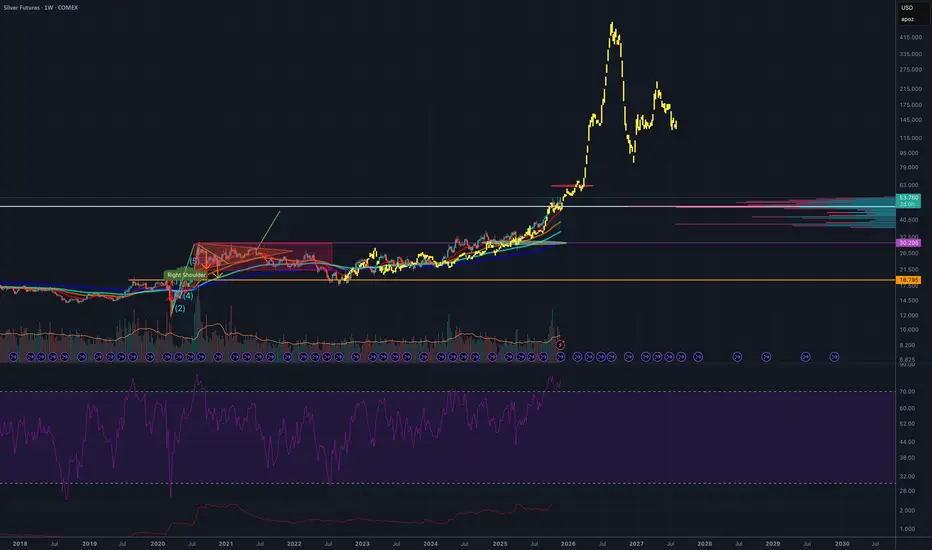
A technical analysis chart that overlays the 1970s silver breakout pattern onto the projected price action for 2025. The chart illustrates how the historical parabolic move that silver experienced during the late-1970s bull cycle could repeat in a modern context. By aligning the timeframes and scaling the price structures, the chart highlights a potential breakout setup forming in 2025 that mirrors the earlier pattern. This visual comparison is used to infer a possible target price for 2026 based on the magnitude and trajectory of the 1970s rally, offering a speculative projection grounded in historical market behavior.
면책사항
해당 정보와 게시물은 금융, 투자, 트레이딩 또는 기타 유형의 조언이나 권장 사항으로 간주되지 않으며, 트레이딩뷰에서 제공하거나 보증하는 것이 아닙니다. 자세한 내용은 이용 약관을 참조하세요.
면책사항
해당 정보와 게시물은 금융, 투자, 트레이딩 또는 기타 유형의 조언이나 권장 사항으로 간주되지 않으며, 트레이딩뷰에서 제공하거나 보증하는 것이 아닙니다. 자세한 내용은 이용 약관을 참조하세요.