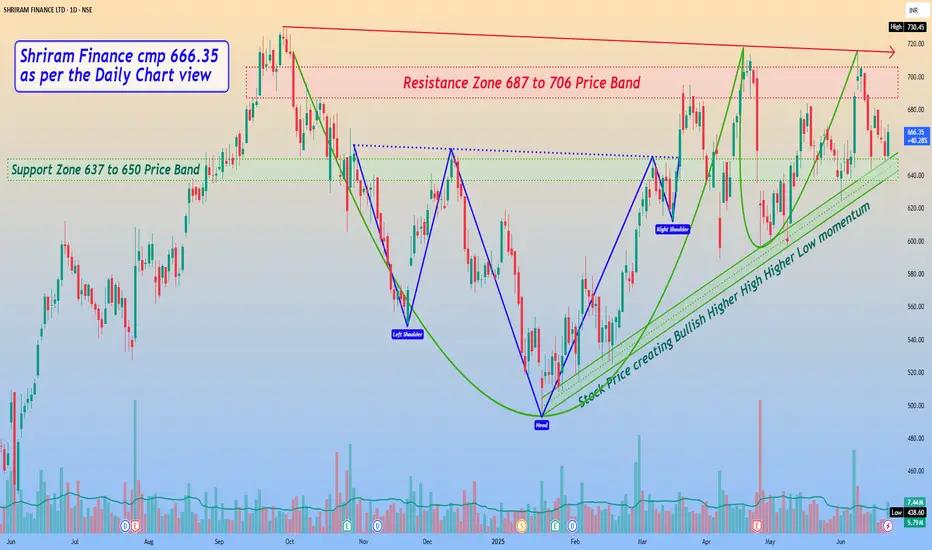
*Shriram Finance cmp 666.35 by Daily Chart view*
- Support Zone 637 to 650 Price Band
- Resistance Zone 687 to 706 Price Band
- *Stock Price creating Bullish Higher High Higher Low momentum*
- Volumes are seen to be in good sync with average traded quantity
- *Price seems testing and retesting the Support Zone over last week*
- Stock made few failed attempts to cross the ATH 730.45 and reversed
- Falling Resistance Trendline and Resistance Zone are good hurdles to crossover
- *Bullish Rounding Bottoms above Resistance Zone neckline and considerate Head & Shoulders is seen*
면책사항
이 정보와 게시물은 TradingView에서 제공하거나 보증하는 금융, 투자, 거래 또는 기타 유형의 조언이나 권고 사항을 의미하거나 구성하지 않습니다. 자세한 내용은 이용 약관을 참고하세요.
면책사항
이 정보와 게시물은 TradingView에서 제공하거나 보증하는 금융, 투자, 거래 또는 기타 유형의 조언이나 권고 사항을 의미하거나 구성하지 않습니다. 자세한 내용은 이용 약관을 참고하세요.