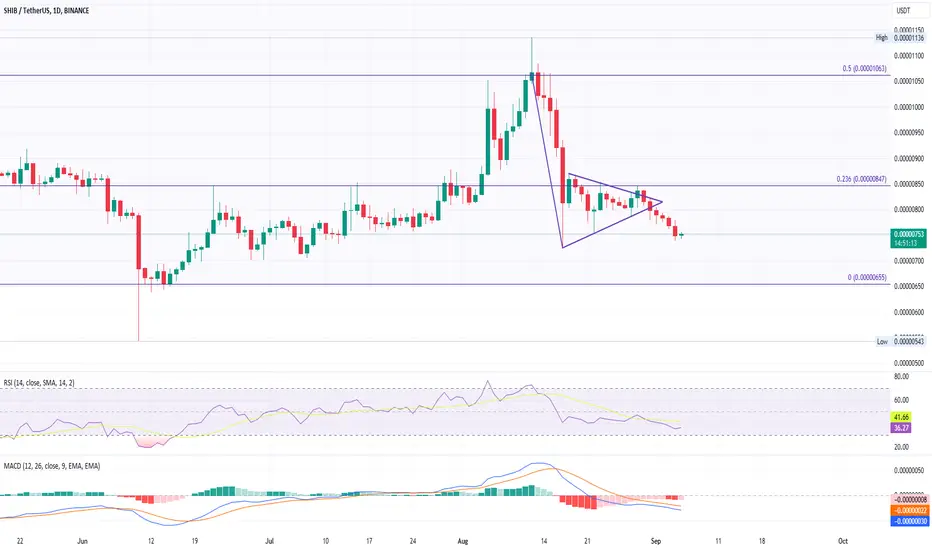
SHIB price breaks a pennant pattern and moves away from the 50-day EMA.
Potential downtrend continuation for SHIB, targeting $0.0000065.
Shiba Inu's 2023 performance shows a 7.64% YTD drop.
SHIB trades at a massive 91.65% discount from its all-time high of $0.00008854.
The 50 and 200-day EMA indicate a bearish trend for SHIB.
SHIB broke its triangle pattern last month, leading to a bearish pennant breakdown.
Over the past six days, SHIB has declined by 10%, currently trading at $0.00000752.
Technical indicators, MACD and RSI, suggest increasing bearish momentum.
Key support levels for SHIB are at $0.0000070 and $0.0000065.
If SHIB breaks above the 50-day EMA, it could target $0.0000090 and potentially $0.000010.
면책사항
이 정보와 게시물은 TradingView에서 제공하거나 보증하는 금융, 투자, 거래 또는 기타 유형의 조언이나 권고 사항을 의미하거나 구성하지 않습니다. 자세한 내용은 이용 약관을 참고하세요.
면책사항
이 정보와 게시물은 TradingView에서 제공하거나 보증하는 금융, 투자, 거래 또는 기타 유형의 조언이나 권고 사항을 의미하거나 구성하지 않습니다. 자세한 내용은 이용 약관을 참고하세요.