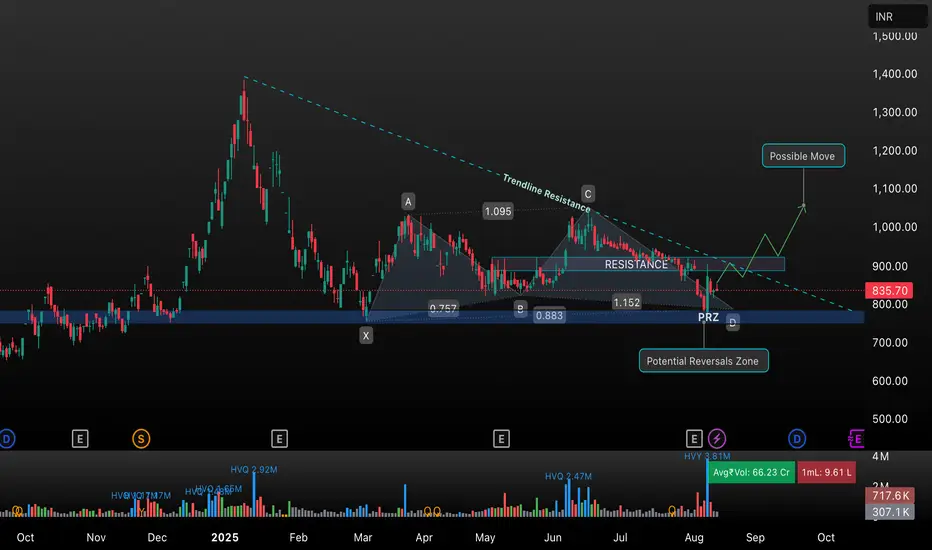
In this analysis, we review the daily chart of Shakti Pumps (SHAKTIPUMP) as presented on TradingView. The stock is currently trading at ₹835.70 and is approaching a crucial trendline resistance. The chart highlights:
• Bearish Trendline Resistance: Connecting recent highs.
• Key Support Zone: Identified as the “Potential Reversal Zone (PRZ)” between ₹750-₹850.
• Bullish Reversal Pattern: The stock has retested the PRZ multiple times, indicating strong support.
• Breakout Setup: A breakout above the resistance could trigger a move towards ₹1,100-₹1,200 as marked in the “Possible Move” target zone.
• Volume Analysis: Observing significant trading volumes at key zones.
Trading Idea:
If the stock breaks above the highlighted resistance and trendline, there is a potential for a strong bullish move. Watch for confirmation and manage risk accordingly.
액티브 트레이드
Volume Surged 면책사항
해당 정보와 게시물은 금융, 투자, 트레이딩 또는 기타 유형의 조언이나 권장 사항으로 간주되지 않으며, 트레이딩뷰에서 제공하거나 보증하는 것이 아닙니다. 자세한 내용은 이용 약관을 참조하세요.
면책사항
해당 정보와 게시물은 금융, 투자, 트레이딩 또는 기타 유형의 조언이나 권장 사항으로 간주되지 않으며, 트레이딩뷰에서 제공하거나 보증하는 것이 아닙니다. 자세한 내용은 이용 약관을 참조하세요.