4H Chart (Swing Context)
Trend: Ascending channel formation after a prior downtrend.
Key Zone: Approaching the 81,900–82,150 supply zone.
Previous Break: Impulsive leg broke above 81,200, now acting as potential demand.
Bias: Bullish momentum, but within a significant resistance zone.
1H Chart (Intraday Context)
Structure: Clear higher highs & higher lows (bullish structure).
Support: 81,200 level (former resistance turned demand) showing strong bounces.
Current Action: Consolidating below the 81,900–82,150 supply.
BOS: Confirms buyer dominance, but upside liquidity appears to be thinning.
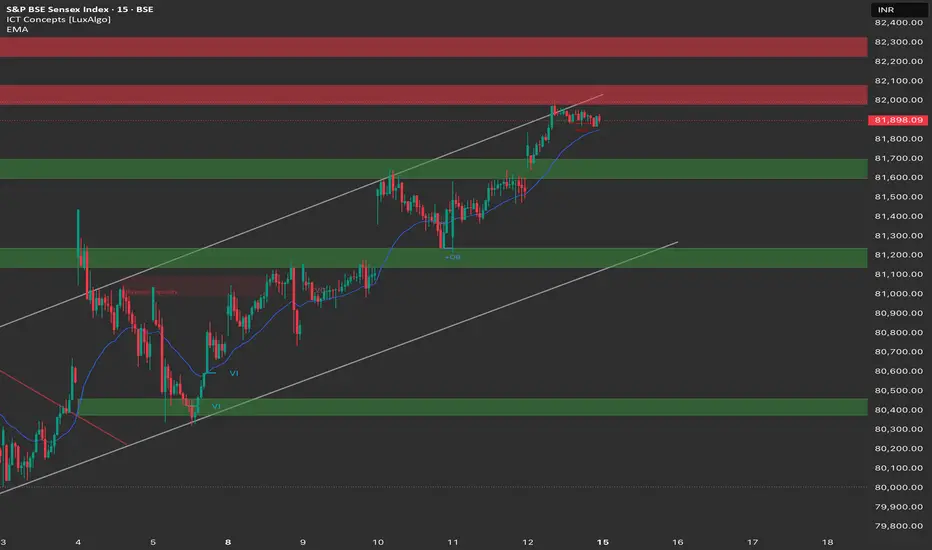
15m Chart (Execution View)
Action: Sideways consolidation below 81,800.
OB: Order block around 81,100–81,200 acts as support buffer.
FVG: Minor FVGs in 81,300–81,350 zone may offer intraday support.
Channel: Price respecting the ascending channel boundaries.
📝 Trade Plan (15th Sept)
Bullish Scenario
Entry: Buy on retracement near 81,100–81,200 demand zone (OB + structure support).
Targets:
TP1: 81,500 (intraday liquidity)
TP2: 81,900–82,000 (supply zone top & channel resistance)
Stop Loss: Below 81,000 (channel bottom & invalidation).
Bearish Scenario
Entry: Short only on rejection of 81,900–82,150 zone with strong bearish signal (e.g., engulfing).
Targets:
TP1: 81,300 (potential FVG fill)
TP2: 81,100–81,200 (major demand zone/OB)
Stop Loss: Above 82,150.
🎯 Bias
Neutral-to-Bullish. Expecting a potential pullback to 81,100–81,200 before a move towards the 81,900–82,150 resistance.
Caution: If 81,100–81,200 fails, expect downside acceleration towards 80,800–80,600.
Trend: Ascending channel formation after a prior downtrend.
Key Zone: Approaching the 81,900–82,150 supply zone.
Previous Break: Impulsive leg broke above 81,200, now acting as potential demand.
Bias: Bullish momentum, but within a significant resistance zone.
1H Chart (Intraday Context)
Structure: Clear higher highs & higher lows (bullish structure).
Support: 81,200 level (former resistance turned demand) showing strong bounces.
Current Action: Consolidating below the 81,900–82,150 supply.
BOS: Confirms buyer dominance, but upside liquidity appears to be thinning.
15m Chart (Execution View)
Action: Sideways consolidation below 81,800.
OB: Order block around 81,100–81,200 acts as support buffer.
FVG: Minor FVGs in 81,300–81,350 zone may offer intraday support.
Channel: Price respecting the ascending channel boundaries.
📝 Trade Plan (15th Sept)
Bullish Scenario
Entry: Buy on retracement near 81,100–81,200 demand zone (OB + structure support).
Targets:
TP1: 81,500 (intraday liquidity)
TP2: 81,900–82,000 (supply zone top & channel resistance)
Stop Loss: Below 81,000 (channel bottom & invalidation).
Bearish Scenario
Entry: Short only on rejection of 81,900–82,150 zone with strong bearish signal (e.g., engulfing).
Targets:
TP1: 81,300 (potential FVG fill)
TP2: 81,100–81,200 (major demand zone/OB)
Stop Loss: Above 82,150.
🎯 Bias
Neutral-to-Bullish. Expecting a potential pullback to 81,100–81,200 before a move towards the 81,900–82,150 resistance.
Caution: If 81,100–81,200 fails, expect downside acceleration towards 80,800–80,600.
면책사항
해당 정보와 게시물은 금융, 투자, 트레이딩 또는 기타 유형의 조언이나 권장 사항으로 간주되지 않으며, 트레이딩뷰에서 제공하거나 보증하는 것이 아닙니다. 자세한 내용은 이용 약관을 참조하세요.
면책사항
해당 정보와 게시물은 금융, 투자, 트레이딩 또는 기타 유형의 조언이나 권장 사항으로 간주되지 않으며, 트레이딩뷰에서 제공하거나 보증하는 것이 아닙니다. 자세한 내용은 이용 약관을 참조하세요.