🔎 Sensex Market Structure
4H Chart
Trend Bias: Bearish channel is intact, price closing below EMA.
Supply Zone: 81,600 – 81,800 (FVG & strong rejection area).
Demand Zone: 80,600 (immediate) and 79,800 (major HTF support).
Outlook: Sellers are in control; bulls need a strong reclaim above 81,200 to change bias.
1H Chart
Current Price: 80,820
Trend: Series of lower highs & lower lows → bearish structure confirmed.
Supply Zone: 81,200 – 81,400 (if price retraces, high probability rejection).
Demand Zone: 80,600 → if broken, 79,800 becomes the key magnet.
Observation: Price is consolidating near demand, but still respecting the bearish channel.
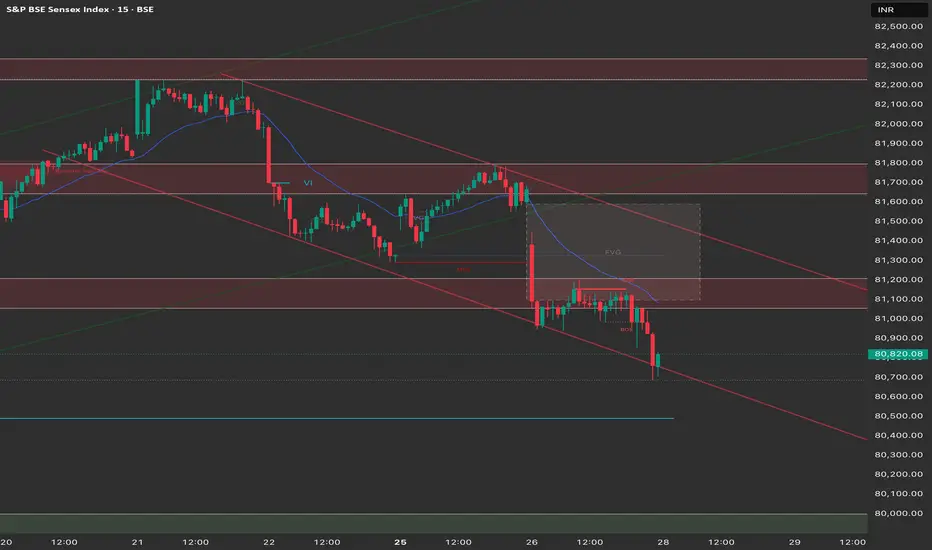
15M Chart
BOS (Break of Structure): Bearish BOS visible below 81,000.
Short-Term Demand: 80,700 – 80,800, currently holding price.
Short-Term Supply: 81,100 – 81,200 (aligned with HTF supply).
Outlook: Any rally into 81,100 – 81,200 should face selling pressure.
📌 Trading Plan for 28th August
🔻 Short Bias (Primary Plan)
Entry: On rejection from 81,100 – 81,200 zone
Target 1: 80,600
Target 2: 79,800 (if momentum strong)
Stoploss: Above 81,400
🔺 Long Bias (Counter-trade, aggressive)
Entry: If price shows strong reversal signals from 80,600 demand
Target: 81,000 – 81,200
Stoploss: Below 80,450
✅ Summary
Bias: Bearish unless 81,200 is reclaimed.
Safe Trade: Sell the rallies into 81,100 – 81,200 supply.
Counter Trade: Only scalp longs near 80,600 with strict risk management.
4H Chart
Trend Bias: Bearish channel is intact, price closing below EMA.
Supply Zone: 81,600 – 81,800 (FVG & strong rejection area).
Demand Zone: 80,600 (immediate) and 79,800 (major HTF support).
Outlook: Sellers are in control; bulls need a strong reclaim above 81,200 to change bias.
1H Chart
Current Price: 80,820
Trend: Series of lower highs & lower lows → bearish structure confirmed.
Supply Zone: 81,200 – 81,400 (if price retraces, high probability rejection).
Demand Zone: 80,600 → if broken, 79,800 becomes the key magnet.
Observation: Price is consolidating near demand, but still respecting the bearish channel.
15M Chart
BOS (Break of Structure): Bearish BOS visible below 81,000.
Short-Term Demand: 80,700 – 80,800, currently holding price.
Short-Term Supply: 81,100 – 81,200 (aligned with HTF supply).
Outlook: Any rally into 81,100 – 81,200 should face selling pressure.
📌 Trading Plan for 28th August
🔻 Short Bias (Primary Plan)
Entry: On rejection from 81,100 – 81,200 zone
Target 1: 80,600
Target 2: 79,800 (if momentum strong)
Stoploss: Above 81,400
🔺 Long Bias (Counter-trade, aggressive)
Entry: If price shows strong reversal signals from 80,600 demand
Target: 81,000 – 81,200
Stoploss: Below 80,450
✅ Summary
Bias: Bearish unless 81,200 is reclaimed.
Safe Trade: Sell the rallies into 81,100 – 81,200 supply.
Counter Trade: Only scalp longs near 80,600 with strict risk management.
면책사항
해당 정보와 게시물은 금융, 투자, 트레이딩 또는 기타 유형의 조언이나 권장 사항으로 간주되지 않으며, 트레이딩뷰에서 제공하거나 보증하는 것이 아닙니다. 자세한 내용은 이용 약관을 참조하세요.
면책사항
해당 정보와 게시물은 금융, 투자, 트레이딩 또는 기타 유형의 조언이나 권장 사항으로 간주되지 않으며, 트레이딩뷰에서 제공하거나 보증하는 것이 아닙니다. 자세한 내용은 이용 약관을 참조하세요.