🔍 Current Positioning
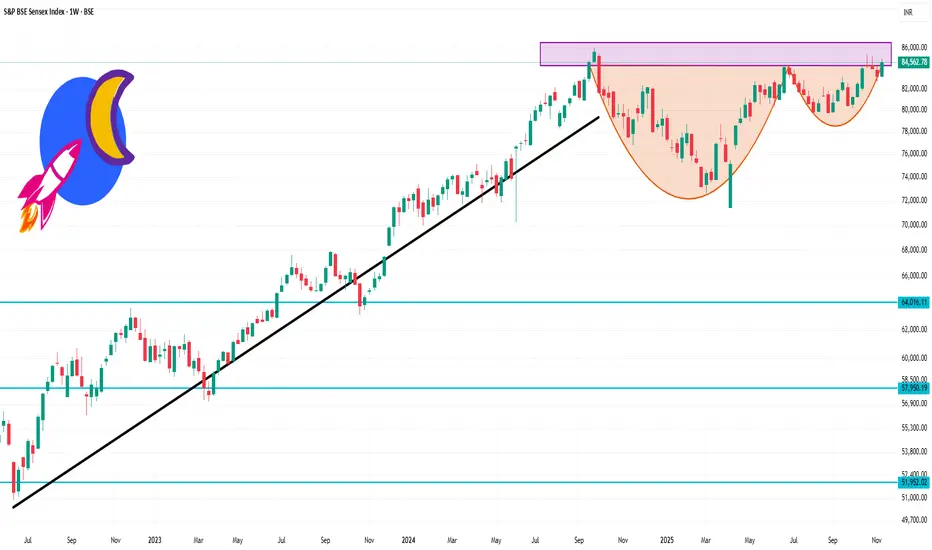
The index is currently trading in the ~ ₹84,500 zone.
Its 52-week high is around ₹85,290 and 52-week low is around ₹71,425.
On a weekly basis it has shown modest upward movement (~1–2 %) in the last week.
📏 Key Levels to Watch (Weekly)
Here are approximate levels to monitor for structure, support/resistance and trading bias:
Resistance zone: ~ ₹85,500–₹86,000 — near the recent highs and potential supply area.
Pivot / mid-zone: ~ ₹84,000–₹84,500 — where the index is currently hovering; acts as short-term equilibrium.
Initial support zone: ~ ₹83,000–₹83,500 — if weekly closes dip below this, risk of deeper correction increases.
Deeper support zone: ~ ₹80,000–₹81,000 — a major support on weekly view, if structure breaks lower.
📊 Weekly Structure & Bias
Because the index is near the highs, the weekly structure suggests caution: upside potential exists, but risk of consolidation or pull-back is higher given the proximity to resistance.
If we see a weekly close above ~₹85,500 with strong momentum, the bullish bias gains strength.
Conversely, a weekly break and close below ~₹83,000 would tilt structure towards a corrective phase and shift bias more neutral to bearish.
At present, the bias is moderately bullish but conditioned on support holding (i.e., above ~₹83K zone).
관련 발행물
면책사항
해당 정보와 게시물은 금융, 투자, 트레이딩 또는 기타 유형의 조언이나 권장 사항으로 간주되지 않으며, 트레이딩뷰에서 제공하거나 보증하는 것이 아닙니다. 자세한 내용은 이용 약관을 참조하세요.
관련 발행물
면책사항
해당 정보와 게시물은 금융, 투자, 트레이딩 또는 기타 유형의 조언이나 권장 사항으로 간주되지 않으며, 트레이딩뷰에서 제공하거나 보증하는 것이 아닙니다. 자세한 내용은 이용 약관을 참조하세요.