1. Symmetrical Triangle Breakout
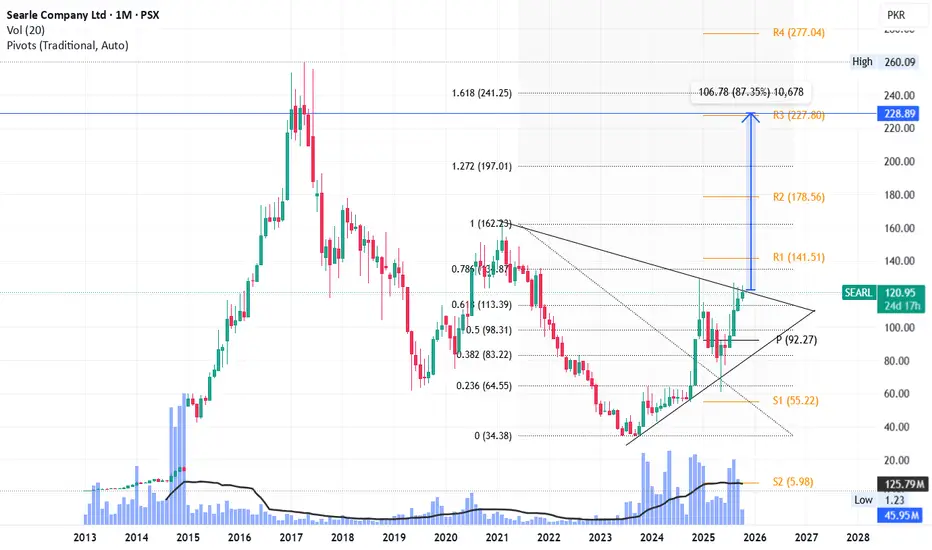
Price has been consolidating since 2021 between roughly PKR 60–120 inside a converging triangle.
Current monthly candle, if breaks above the triangle’s upper trendline, it will be a bullish breakout signal.
2. Fibonacci Retracement & Extension
The full retracement from 162 (2021 high) to 34 (2023 low) is plotted.
Current price (~121) has surpassed the 0.618 retracement (113) — a key resistance level — turning it into support.
Next Fibonacci extension targets:
0.786 level (134.87) — minor resistance.
1.0 level (162.23) — Major resistance & previous high.
1.272 (197.01) — Next bullish target after breakout.
1.618 (241.25) — Extended target zone, coinciding with strong pivot resistance.
Pivot Levels (Monthly)
Pivot Level (PKR)
Pivot (P) 92.27 Previous breakout zone / strong base
R1 141.51 Short-term resistance / first target
R2 178.56 Mid-term target
R3 227.80 Long-term breakout extension target
R4 277.04 Extended bull run potential
Volume & Momentum
Noticeable volume surge in 2023–2025 suggests institutional accumulation.
RSI (not shown but inferred from price pattern) likely moving toward overbought but still healthy for a breakout continuation.
Technical Outlook
Short-term Bullish Breakout above triangle & 0.618 Fib with volume
Medium-term Bullish to Strong Next resistances at 141 → 162 → 178
Long-term Potential target zone: 220–240 Matches R3 & 1.618 Fib extension
Invalidation / Stop Level
If the price closes below PKR 92 (Pivot support) on monthly basis, it would invalidate the breakout and return to consolidation.
Summary
Breakout confirmation: if monthly candle closes above 120
Next technical targets:
T1: 141
T2: 162
T3: 197
T4 (Extended): 228–241
Support levels: 113, 92, and 64
Trend: Reversal to uptrend after 5-year downtrend.
면책사항
해당 정보와 게시물은 금융, 투자, 트레이딩 또는 기타 유형의 조언이나 권장 사항으로 간주되지 않으며, 트레이딩뷰에서 제공하거나 보증하는 것이 아닙니다. 자세한 내용은 이용 약관을 참조하세요.
면책사항
해당 정보와 게시물은 금융, 투자, 트레이딩 또는 기타 유형의 조언이나 권장 사항으로 간주되지 않으며, 트레이딩뷰에서 제공하거나 보증하는 것이 아닙니다. 자세한 내용은 이용 약관을 참조하세요.