Starbucks (SBUX) – 4 Warning Signs Point to a Potential Downturn
Traders and investors should be cautious on SBUX as multiple technical indicators are signaling a bearish outlook across different timeframes. Here’s a breakdown of the red flags:
1. Negative Volume Pressure
Recent trading sessions have shown a decline in volume on upward moves, while downward moves are backed by heavier
selling volume. This imbalance suggests that buyers are losing control, and the stock may be set for a further pullback.
2. Balance of Power (BOP) Turns Bearish
The Balance of Power (BOP) indicator, which measures buyer vs.
seller dominance, has flipped into negative territory. A bearish BOP indicates that sellers are gaining control over the market, confirming the negative volume trend.
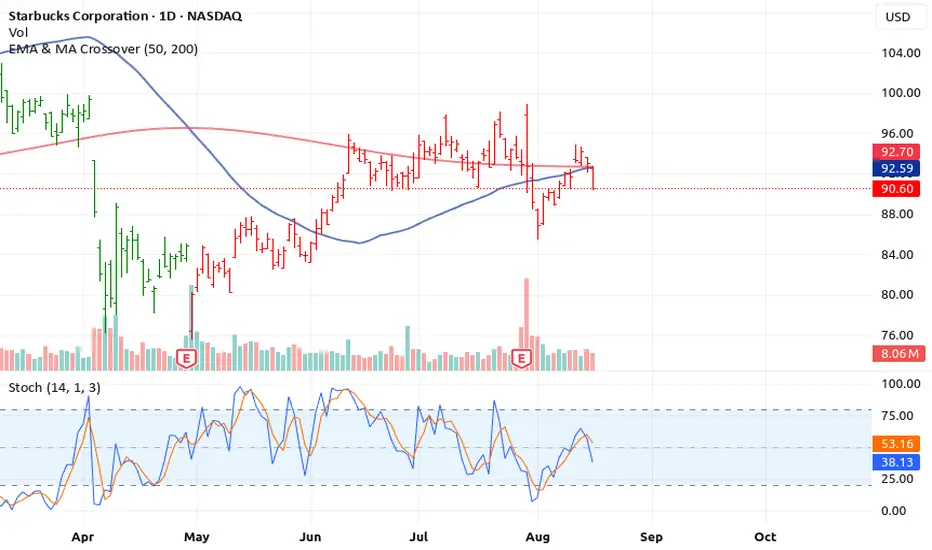
3. EMA Crossover Signals Trend Weakness
The short-term EMA (e.g., 50 EMA) has started crossing below the
long-term EMA (e.g., 200 EMA), a classic signal of a downtrend formation. EMA crossovers are widely regarded as reliable indicators for trend direction.
4. Stochastic Divergence Confirms Bearish Momentum
Finally, the Stochastic oscillator is showing a bearish divergence, with price making higher highs while Stoch fails to confirm them.
This often precedes sharp reversals or pullbacks.
⚠️ Conclusion
All four indicators — negative volume, bearish BOP, EMA cross down, and Stochastic divergence — align to suggest that SBUX
may be heading toward a correction or short-term crash. Traders should consider tightening stops, reducing exposure, or exploring short positions in accordance with their risk strategy.
Also remember we are using the 50,200 EMA thats the rocket booster strategy
Rocket boost this content to learn more.
Disclaimer: This is technical analysis only and not financial advice. Always conduct your own research and consider your risk tolerance before making trading decisions.
Also use a simulation trading account before you trade with real money, learn risk management and profit taking strategies.
Traders and investors should be cautious on SBUX as multiple technical indicators are signaling a bearish outlook across different timeframes. Here’s a breakdown of the red flags:
1. Negative Volume Pressure
Recent trading sessions have shown a decline in volume on upward moves, while downward moves are backed by heavier
selling volume. This imbalance suggests that buyers are losing control, and the stock may be set for a further pullback.
2. Balance of Power (BOP) Turns Bearish
The Balance of Power (BOP) indicator, which measures buyer vs.
seller dominance, has flipped into negative territory. A bearish BOP indicates that sellers are gaining control over the market, confirming the negative volume trend.
3. EMA Crossover Signals Trend Weakness
The short-term EMA (e.g., 50 EMA) has started crossing below the
long-term EMA (e.g., 200 EMA), a classic signal of a downtrend formation. EMA crossovers are widely regarded as reliable indicators for trend direction.
4. Stochastic Divergence Confirms Bearish Momentum
Finally, the Stochastic oscillator is showing a bearish divergence, with price making higher highs while Stoch fails to confirm them.
This often precedes sharp reversals or pullbacks.
⚠️ Conclusion
All four indicators — negative volume, bearish BOP, EMA cross down, and Stochastic divergence — align to suggest that SBUX
may be heading toward a correction or short-term crash. Traders should consider tightening stops, reducing exposure, or exploring short positions in accordance with their risk strategy.
Also remember we are using the 50,200 EMA thats the rocket booster strategy
Rocket boost this content to learn more.
Disclaimer: This is technical analysis only and not financial advice. Always conduct your own research and consider your risk tolerance before making trading decisions.
Also use a simulation trading account before you trade with real money, learn risk management and profit taking strategies.
관련 발행물
면책사항
이 정보와 게시물은 TradingView에서 제공하거나 보증하는 금융, 투자, 거래 또는 기타 유형의 조언이나 권고 사항을 의미하거나 구성하지 않습니다. 자세한 내용은 이용 약관을 참고하세요.
관련 발행물
면책사항
이 정보와 게시물은 TradingView에서 제공하거나 보증하는 금융, 투자, 거래 또는 기타 유형의 조언이나 권고 사항을 의미하거나 구성하지 않습니다. 자세한 내용은 이용 약관을 참고하세요.