📈 1-Hour Time Frame Technical Overview
On the 1-hour chart, the technical indicators for SBIN futures are as follows:
Moving Averages: Strong Buy
Oscillators: Neutral
Overall Technical Rating: Strong Buy
This suggests a bullish short-term trend, with moving averages indicating upward momentum.
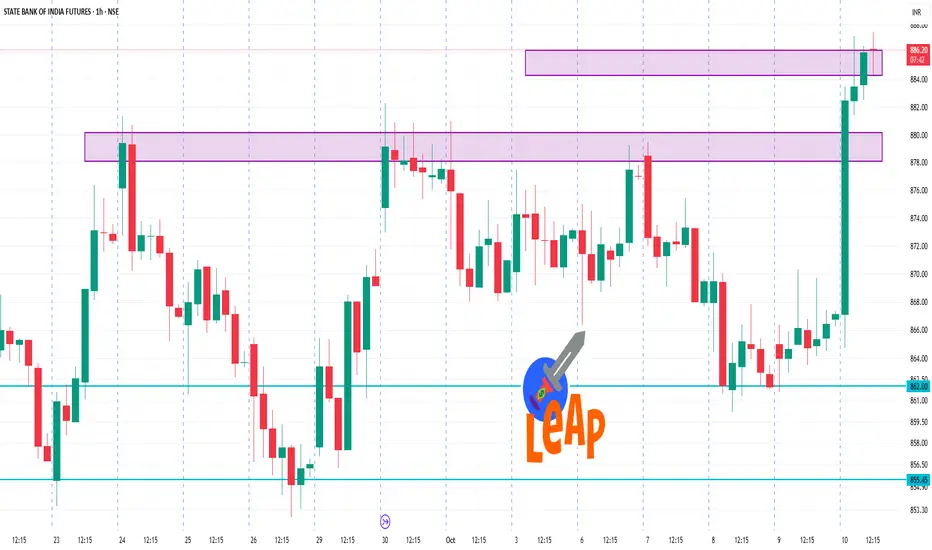
🔄 Key Levels to Watch
Based on recent intraday analysis, the following levels are noteworthy:
Resistance Levels: ₹880.88
Support Levels: ₹863.38
These levels can serve as potential entry or exit points for traders.
📊 Additional Insights
Open Interest: Approximately 94.62 million contracts, indicating active participation.
Volume: Around 13.07 million contracts traded, reflecting healthy liquidity.
On the 1-hour chart, the technical indicators for SBIN futures are as follows:
Moving Averages: Strong Buy
Oscillators: Neutral
Overall Technical Rating: Strong Buy
This suggests a bullish short-term trend, with moving averages indicating upward momentum.
🔄 Key Levels to Watch
Based on recent intraday analysis, the following levels are noteworthy:
Resistance Levels: ₹880.88
Support Levels: ₹863.38
These levels can serve as potential entry or exit points for traders.
📊 Additional Insights
Open Interest: Approximately 94.62 million contracts, indicating active participation.
Volume: Around 13.07 million contracts traded, reflecting healthy liquidity.
관련 발행물
면책사항
해당 정보와 게시물은 금융, 투자, 트레이딩 또는 기타 유형의 조언이나 권장 사항으로 간주되지 않으며, 트레이딩뷰에서 제공하거나 보증하는 것이 아닙니다. 자세한 내용은 이용 약관을 참조하세요.
관련 발행물
면책사항
해당 정보와 게시물은 금융, 투자, 트레이딩 또는 기타 유형의 조언이나 권장 사항으로 간주되지 않으며, 트레이딩뷰에서 제공하거나 보증하는 것이 아닙니다. 자세한 내용은 이용 약관을 참조하세요.