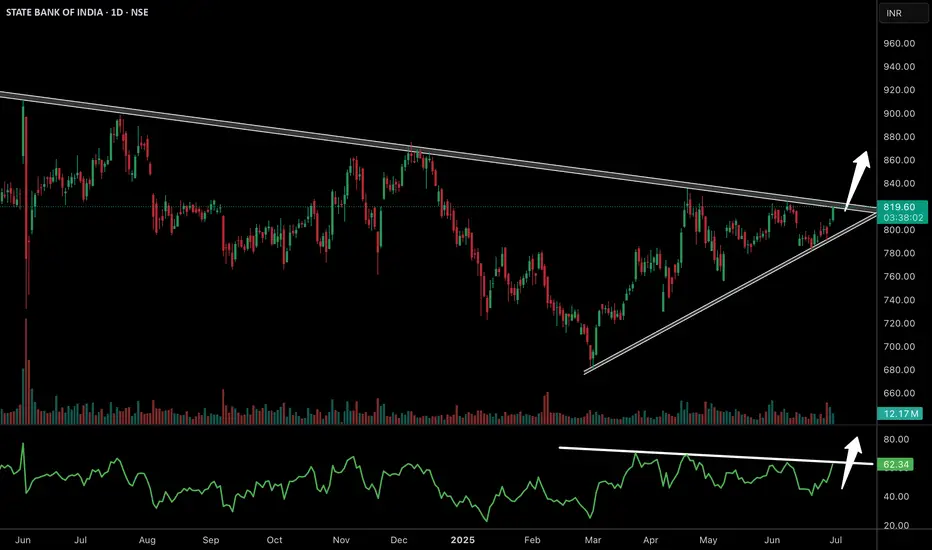
✅ The stock has formed a large symmetrical triangle pattern on the daily chart, with price compressing and now approaching the apex, suggesting a strong move is imminent.
✅ The recent candles show higher lows, confirming buyers are stepping in on every dip. RSI was in a falling wedge and has now broken to the upside above 62, indicating strengthening momentum.
✅ A clear breakout above the upper trendline near 825–830 with volume can lead to a sustained rally towards 880–920 levels in the coming weeks.
✅ PSU banks remain in focus with strong credit growth and stable asset quality. SBI being the largest lender, will benefit from robust business momentum.
Join our community in telegram for real time updates --- telegram.me/marketiik
Telegram- telegram.me/marketiik
A simple trader, distancing from the fake crowd. Simplifying complexity, I prioritize genuine insights over trends.
Telegram- telegram.me/marketiik
A simple trader, distancing from the fake crowd. Simplifying complexity, I prioritize genuine insights over trends.
면책사항
해당 정보와 게시물은 금융, 투자, 트레이딩 또는 기타 유형의 조언이나 권장 사항으로 간주되지 않으며, 트레이딩뷰에서 제공하거나 보증하는 것이 아닙니다. 자세한 내용은 이용 약관을 참조하세요.