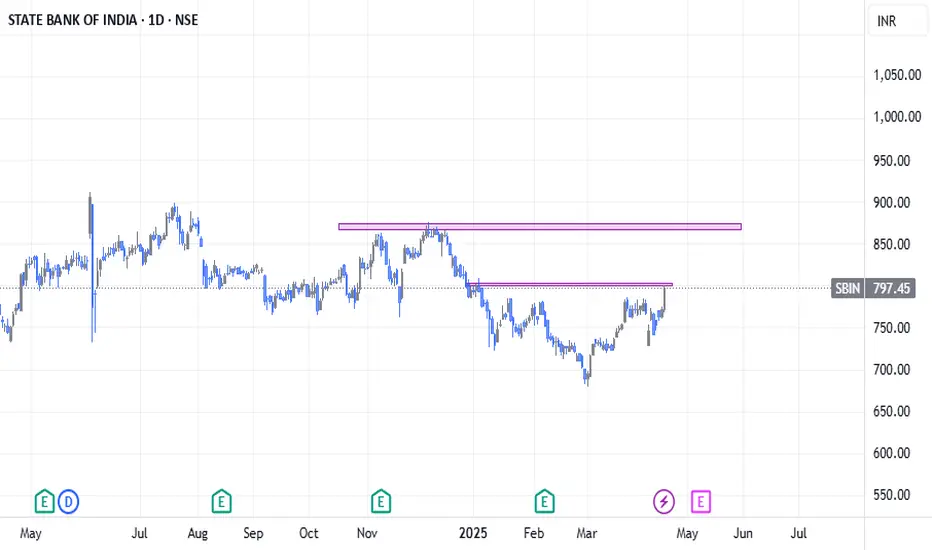
📈 Technical Analysis:
Strong breakout seen on the daily chart after price moved above a key neckline zone, signaling potential trend reversal.
Price has also closed above the 200-day moving average (200 MA) on the daily timeframe – a strong bullish indicator.
On the weekly chart, there's noticeable buying momentum, with a breakout above the 50-week moving average (50 MA), confirming strength on a higher timeframe.
📊 Overall View:
Multiple bullish confirmations across daily and weekly charts suggest further upside potential.
A successful of the breakout zone could lead to strong upward continuation.
✅ Bias: Bullish
🔎 Watch Levels:
Support: Breakout zone / 200 MA
Resistance: Previous swing highs
🚫 Disclaimer: This is not financial advice. Please do your own research and consult your financial advisor before making any investment decisions.
거래청산: 타겟 닿음
면책사항
해당 정보와 게시물은 금융, 투자, 트레이딩 또는 기타 유형의 조언이나 권장 사항으로 간주되지 않으며, 트레이딩뷰에서 제공하거나 보증하는 것이 아닙니다. 자세한 내용은 이용 약관을 참조하세요.
면책사항
해당 정보와 게시물은 금융, 투자, 트레이딩 또는 기타 유형의 조언이나 권장 사항으로 간주되지 않으며, 트레이딩뷰에서 제공하거나 보증하는 것이 아닙니다. 자세한 내용은 이용 약관을 참조하세요.