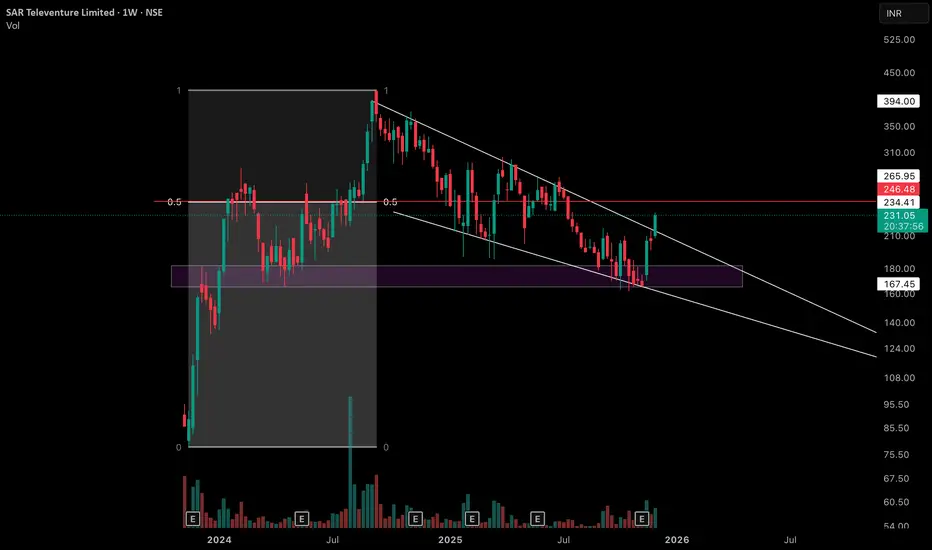
Observation 1 - On this weekly chart of SAR Televenture Limited, price has created an interesting equilibrium between the major swing low and the all‑time high swing high, with the 0.5 level highlighted by the red horizontal line as a key mid‑point reference.
Observation 2 - The purple zone marked on the chart was earlier a clear supply / resistance area but has now flipped into a support zone, getting respected multiple times over the past several weeks.
Observation 3 - After printing its all‑time high, price has moved into a sequence of lower highs and lower lows, but each leg has remained relatively controlled instead of showing any one‑sided, sharp liquidation move. This creates a broader consolidation structure where volatility is present yet contained.
Observation 4 - The white lines on the chart represent the upper and lower rejection boundaries of this consolidation channel, and most of the recent candles are developing within these two lines.
Disclaimer: This post is purely for educational and informational purposes, intended to study price structure and market behavior on the weekly timeframe. It is not investment advice or a recommendation to buy or sell any security; traders and investors should do their own research and consult a registered financial professional before making any decisions.
🎯 Master My Self-Made Trading Strategy
📈 Telegram (Learn Today): t.me/hashtaghammer
✅ WhatsApp (Learn Today): wa.me/919455664601
📈 Telegram (Learn Today): t.me/hashtaghammer
✅ WhatsApp (Learn Today): wa.me/919455664601
관련 발행물
면책사항
해당 정보와 게시물은 금융, 투자, 트레이딩 또는 기타 유형의 조언이나 권장 사항으로 간주되지 않으며, 트레이딩뷰에서 제공하거나 보증하는 것이 아닙니다. 자세한 내용은 이용 약관을 참조하세요.