//version=5
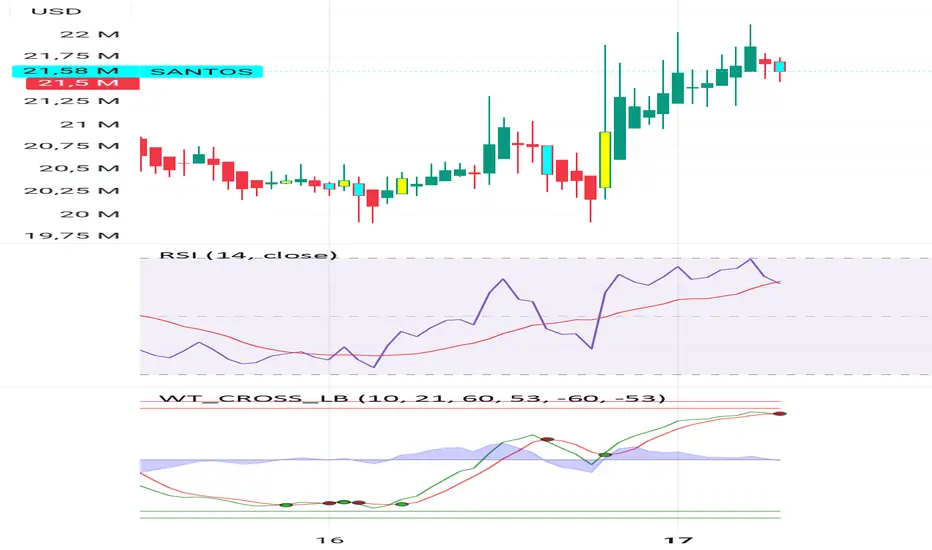
indicator(title="WaveTrend Sinyali ", shorttitle="WT SIGNAL", overlay=true)
// Girdi parametreleri
n1 = input.int(10, "Kanal Uzunluğu")
n2 = input.int(21, "Ortalama Uzunluğu")
obLevel1 = input.int(60, "Aşırı Alım Seviye 1")
obLevel2 = input.int(53, "Aşırı Alım Seviye 2")
osLevel1 = input.int(-60, "Aşırı Satım Seviye 1")
osLevel2 = input.int(-53, "Aşırı Satım Seviye 2")
// WaveTrend hesaplaması
ap = ta.hlc3
esa = ta.ema(ap, n1)
d = ta.ema(math.abs(ap - esa), n1)
ci = (ap - esa) / (0.015 * d)
tci = ta.ema(ci, n2)
wt1 = tci
wt2 = ta.sma(wt1, 4)
// WT çizgileri
plot(wt1, color=color.green, title="WT1")
plot(wt2, color=color.red, title="WT2")
histo = wt1 - wt2
plot(histo, color=color.blue, style=plot.style_columns, title="Histogram")
// Kesişim ve sinyal kontrolü
bullCross = ta.crossover(wt1, wt2) and wt1 < osLevel1
bearCross = ta.crossunder(wt1, wt2) and wt1 > obLevel1
// Etiketler
if bullCross
label.new(bar_index, low, "AL", style=label.style_label_up, color=color.lime, textcolor=color.white, size=size.normal)
if bearCross
label.new(bar_index, high, "SAT", style=label.style_label_down, color=color.red, textcolor=color.white, size=size.normal)
// Bar renkleri
barcolor(bullCross ? color.aqua : bearCross ? color.yellow : na)
액티브 트레이드
//version=5indicator(title="WaveTrend , shorttitle="WT", overlay=true)
// Girdi parametreleri
n1 = input.int(10, "Kanal Uzunluğu")
n2 = input.int(21, "Ortalama Uzunluğu")
obLevel1 = input.int(60, "Aşırı Alım Seviye 1")
obLevel2 = input.int(53, "Aşırı Alım Seviye 2")
osLevel1 = input.int(-60, "Aşırı Satım Seviye 1")
osLevel2 = input.int(-53, "Aşırı Satım Seviye 2")
// WaveTrend hesaplaması
ap = ta.hlc3
esa = ta.ema(ap, n1)
d = ta.ema(math.abs(ap - esa), n1)
ci = (ap - esa) / (0.015 * d)
tci = ta.ema(ci, n2)
wt1 = tci
wt2 = ta.sma(wt1, 4)
// WT çizgileri
plot(wt1, color=color.green, title="WT1")
plot(wt2, color=color.red, title="WT2")
histo = wt1 - wt2
plot(histo, color=color.blue, style=plot.style_columns, title="Histogram")
// Kesişim ve sinyal kontrolü
bullCross = ta.crossover(wt1, wt2) and wt1 < osLevel1
bearCross = ta.crossunder(wt1, wt2) and wt1 > obLevel1
// Etiketler
if bullCross
label.new(bar_index, low, "AL", style=label.style_label_up, color=color.lime, textcolor=color.white, size=size.normal)
if bearCross
label.new(bar_index, high, "SAT", style=label.style_label_down, color=color.red, textcolor=color.white, size=size.normal)
// Bar renkleri
barcolor(bullCross ? color.aqua : bearCross ? color.yellow : na)
면책사항
해당 정보와 게시물은 금융, 투자, 트레이딩 또는 기타 유형의 조언이나 권장 사항으로 간주되지 않으며, 트레이딩뷰에서 제공하거나 보증하는 것이 아닙니다. 자세한 내용은 이용 약관을 참조하세요.
면책사항
해당 정보와 게시물은 금융, 투자, 트레이딩 또는 기타 유형의 조언이나 권장 사항으로 간주되지 않으며, 트레이딩뷰에서 제공하거나 보증하는 것이 아닙니다. 자세한 내용은 이용 약관을 참조하세요.