Key Intraday Data:
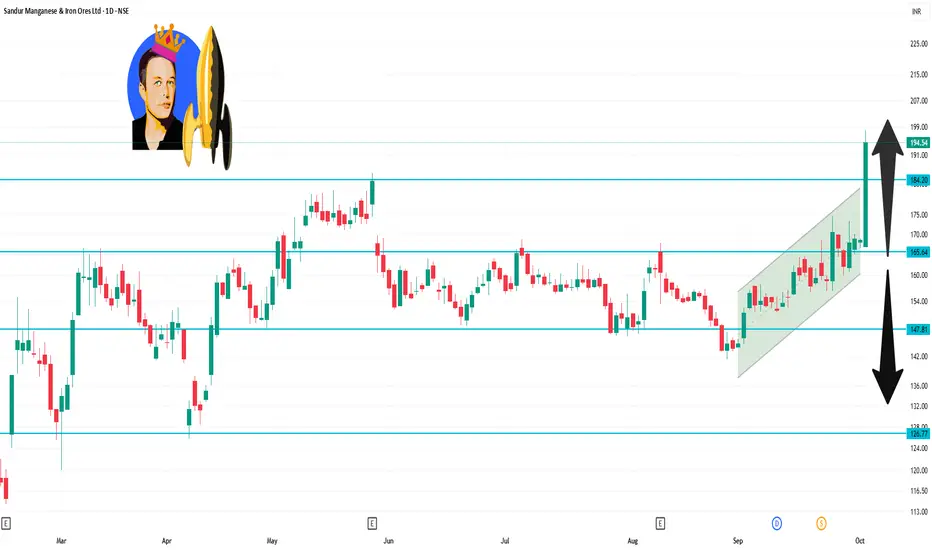
Opening Price: ₹167.00
Closing Price: ₹194.40
Day’s Range: ₹166.85 – ₹198.10
52-Week Range: ₹112.77 – ₹198.10
Volume Traded: Approximately 36.3 million shares
Market Capitalization: ₹9,457 crore
The stock closed at ₹194.40, marking a 15.34% increase from the previous close of ₹168.54. It also achieved a new 52-week high of ₹198.10 during the day.
Technical Indicators:
Technical analysis indicates a strong bullish trend for the stock. The Relative Strength Index (RSI) stands at 78.05, suggesting that the stock is approaching overbought territory.
관련 발행물
면책사항
해당 정보와 게시물은 금융, 투자, 트레이딩 또는 기타 유형의 조언이나 권장 사항으로 간주되지 않으며, 트레이딩뷰에서 제공하거나 보증하는 것이 아닙니다. 자세한 내용은 이용 약관을 참조하세요.
관련 발행물
면책사항
해당 정보와 게시물은 금융, 투자, 트레이딩 또는 기타 유형의 조언이나 권장 사항으로 간주되지 않으며, 트레이딩뷰에서 제공하거나 보증하는 것이 아닙니다. 자세한 내용은 이용 약관을 참조하세요.