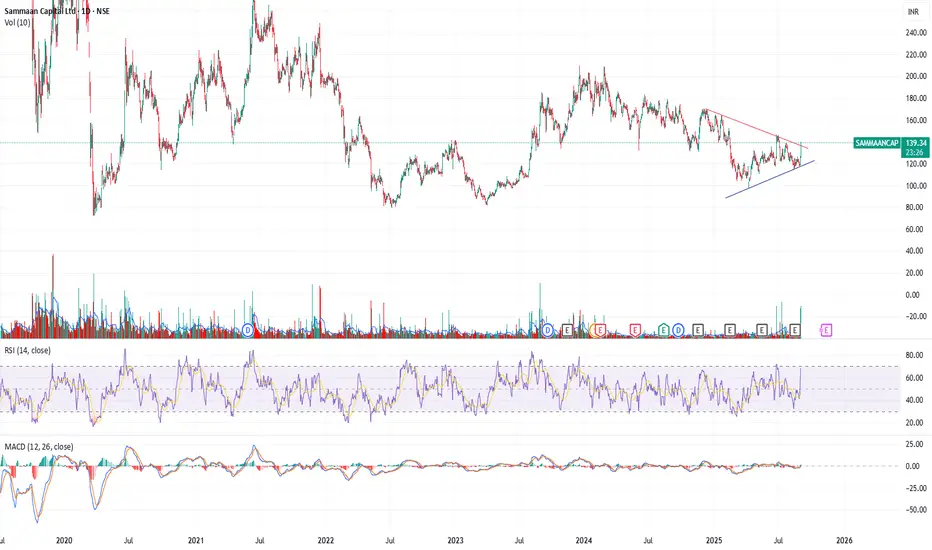
The chart for SAMMAANCAP (NSE) is signaling a bullish breakout from a symmetrical triangle or wedge pattern, propelled by a sharp jump in price (+10.66%) and a substantial surge in trading volume, which often marks the start of upward momentum. Technical indicators reinforce this bullishness: the RSI is near 68, approaching overbought territory but not yet extreme, and the MACD shows a positive crossover with growing histogram strength, both pointing to continued upside potential. With price now above short-term moving averages (EMA 9, 21, 50), and volume confirming the breakout, a fresh long position can be considered above ₹138 with a stop loss around ₹126, and first targets near ₹150–₹160 where previous resistance lie
면책사항
해당 정보와 게시물은 금융, 투자, 트레이딩 또는 기타 유형의 조언이나 권장 사항으로 간주되지 않으며, 트레이딩뷰에서 제공하거나 보증하는 것이 아닙니다. 자세한 내용은 이용 약관을 참조하세요.
면책사항
해당 정보와 게시물은 금융, 투자, 트레이딩 또는 기타 유형의 조언이나 권장 사항으로 간주되지 않으며, 트레이딩뷰에서 제공하거나 보증하는 것이 아닙니다. 자세한 내용은 이용 약관을 참조하세요.