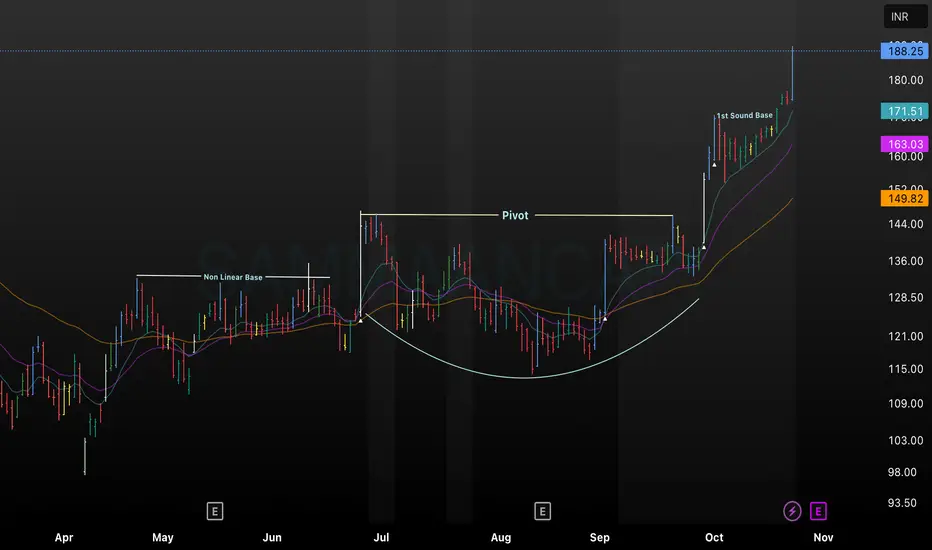
This TradingView chart displays a textbook Cup and Handle breakout pattern in Sammaan Capital (SAMMAANCAP). The setup begins with a “Non Linear Base,” transitions into an extended consolidation, and establishes a clear pivot zone before the breakout. A rapid surge follows, confirmed by the formation of the “1st Sound Base,” and supported by rising moving averages. This annotated chart is ideal for traders examining advanced base patterns and breakout behavior in Indian NBFC stocks, offering valuable reference for strategy building and technical analysis education
면책사항
해당 정보와 게시물은 금융, 투자, 트레이딩 또는 기타 유형의 조언이나 권장 사항으로 간주되지 않으며, 트레이딩뷰에서 제공하거나 보증하는 것이 아닙니다. 자세한 내용은 이용 약관을 참조하세요.
면책사항
해당 정보와 게시물은 금융, 투자, 트레이딩 또는 기타 유형의 조언이나 권장 사항으로 간주되지 않으며, 트레이딩뷰에서 제공하거나 보증하는 것이 아닙니다. 자세한 내용은 이용 약관을 참조하세요.