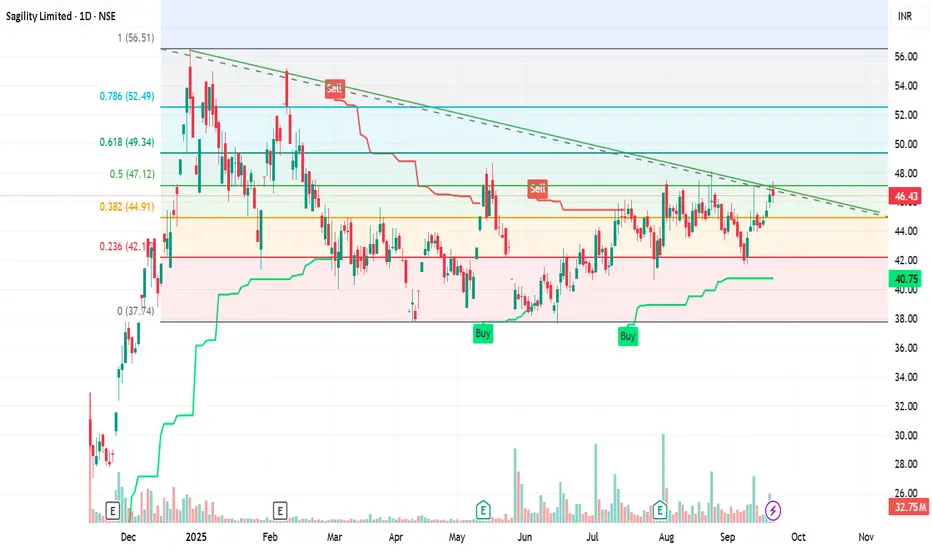
The chart of Sagility Limited on the NSE reveals a technically rich setup with several key signals. Here's a breakdown of what it indicates:
📉 Trend Analysis
- Descending Trendline: The stock has been forming lower highs, suggesting a downtrend or bearish sentiment.
- Current Price: ₹45.60, down 1.40% on the day—still trading below key resistance levels.
🔍 Fibonacci Retracement
- Levels like 0.236, 0.382, 0.5, 0.618, and 0.786 are plotted.
- These help identify potential reversal zones. If price breaks above the 0.382 or 0.5 level, it could signal a bullish retracement.
🟩🟥 Support & Resistance Zones
- Green shaded areas: Strong support zones where buyers may step in.
- Red shaded areas: Resistance zones where selling pressure could emerge.
- Price is currently hovering near a support zone—watch for a bounce or breakdown.
📊 Volume & Momentum
- Volume bars show moderate activity, but no major spikes—suggesting consolidation.
- The green line (likely a moving average) is sloping downward, reinforcing the bearish bias unless price crosses above it.
🟢🔴 Buy/Sell Signals
- Recent “Sell” signal near the descending trendline confirms weakness.
- Previous “Buy” signals occurred near support zones—if price approaches those again, it may offer a short-term opportunity.
🧠 What to Watch For
- Breakout above the descending trendline: Could trigger bullish momentum.
- Breakdown below support: May lead to further downside.
- Volume confirmation: A spike in volume with price movement adds conviction
🧠 Strategic Takeaways
- Bullish bias only above ₹47.25 with confirmation.
- Bearish continuation if ₹42.625 breaks.
- Gann levels align well with Fibonacci zones—giving confluence
액티브 트레이드
Exactly at the resistance. Now the news came from US has made pull back from resistance면책사항
이 정보와 게시물은 TradingView에서 제공하거나 보증하는 금융, 투자, 거래 또는 기타 유형의 조언이나 권고 사항을 의미하거나 구성하지 않습니다. 자세한 내용은 이용 약관을 참고하세요.
면책사항
이 정보와 게시물은 TradingView에서 제공하거나 보증하는 금융, 투자, 거래 또는 기타 유형의 조언이나 권고 사항을 의미하거나 구성하지 않습니다. 자세한 내용은 이용 약관을 참고하세요.