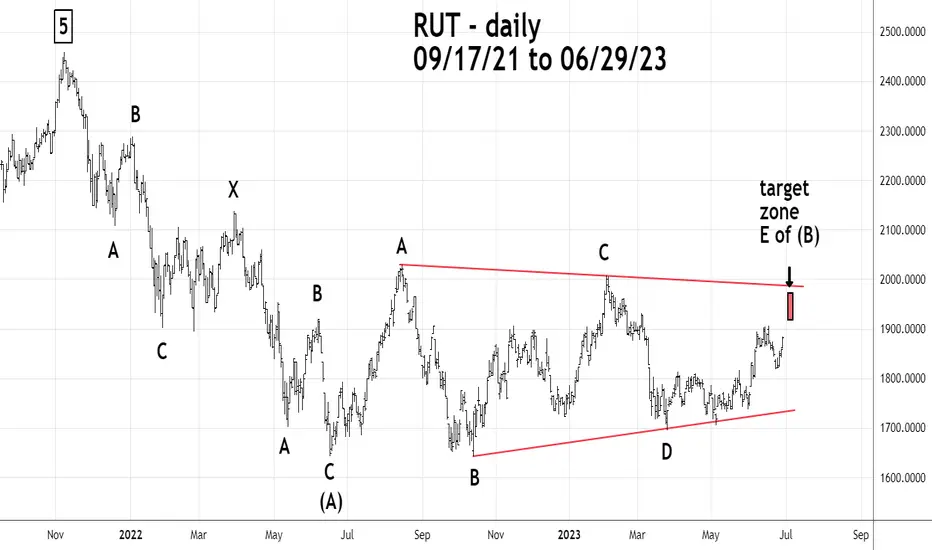
The Russell 2000 (RUT) from its high in November 2021 has a fascinating Elliott wave pattern.
The November 2021 to June 2022 is a Double Zigzag.
From June 2022 to the present it appears the RUT is forming a Horizontal Triangle which is a sideways correction pattern.
If correct, the pattern could complete sometime next week in the area of 1920 to 1975. If it completes RUT could then decline to at least the June 2022 possibly much lower.
관련 발행물
면책사항
해당 정보와 게시물은 금융, 투자, 트레이딩 또는 기타 유형의 조언이나 권장 사항으로 간주되지 않으며, 트레이딩뷰에서 제공하거나 보증하는 것이 아닙니다. 자세한 내용은 이용 약관을 참조하세요.
면책사항
해당 정보와 게시물은 금융, 투자, 트레이딩 또는 기타 유형의 조언이나 권장 사항으로 간주되지 않으며, 트레이딩뷰에서 제공하거나 보증하는 것이 아닙니다. 자세한 내용은 이용 약관을 참조하세요.