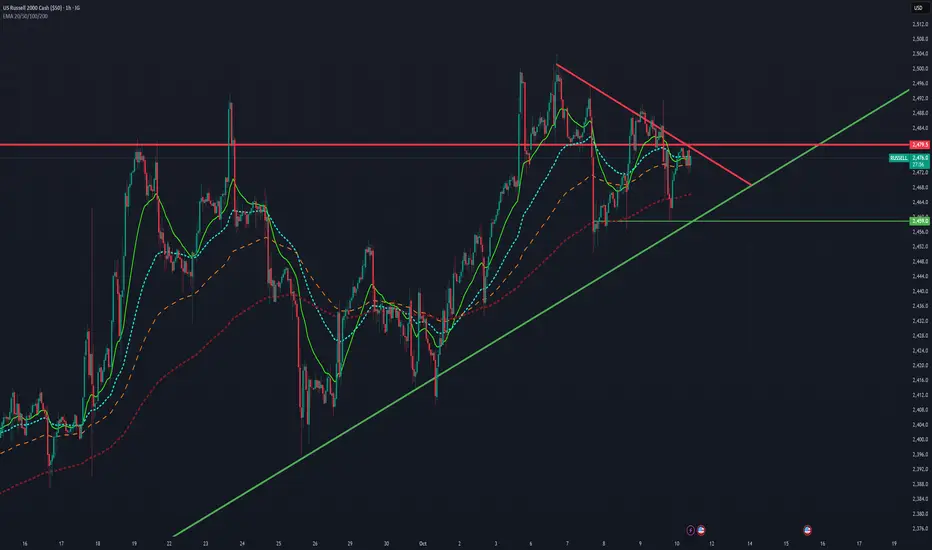
Looking at the current 1-hour chart of the US Russell 2000 Index, several technical factors suggest that the small-cap market may be leaning toward a bearish sentiment in the short term.
First, price action has formed a descending triangle pattern, a structure that often signals potential downside continuation. The upper trendline (shown in red) indicates consistent lower highs, suggesting selling pressure is gradually increasing. Meanwhile, the green ascending trendline underneath shows that buyers have been defending support—but each bounce has been weaker than the last.
The index is currently consolidating near a critical resistance level around 2,479, a zone that has rejected price multiple times. Failure to break above this resistance could trigger a move back toward the 2,459–2,460 support area or even lower if selling accelerates.
Additionally, the short-term moving averages (EMA 20 and 50) are flattening and showing early signs of a potential crossover below the longer EMAs (100/200), a classic bearish signal that often precedes downward momentum.
In summary, while the long-term trendline support remains intact, the combination of a descending triangle, resistance rejection, and weakening momentum makes the small-cap market vulnerable to a short-term bearish move unless buyers reclaim the 2,480 zone decisively.
면책사항
이 정보와 게시물은 TradingView에서 제공하거나 보증하는 금융, 투자, 거래 또는 기타 유형의 조언이나 권고 사항을 의미하거나 구성하지 않습니다. 자세한 내용은 이용 약관을 참고하세요.
면책사항
이 정보와 게시물은 TradingView에서 제공하거나 보증하는 금융, 투자, 거래 또는 기타 유형의 조언이나 권고 사항을 의미하거나 구성하지 않습니다. 자세한 내용은 이용 약관을 참고하세요.