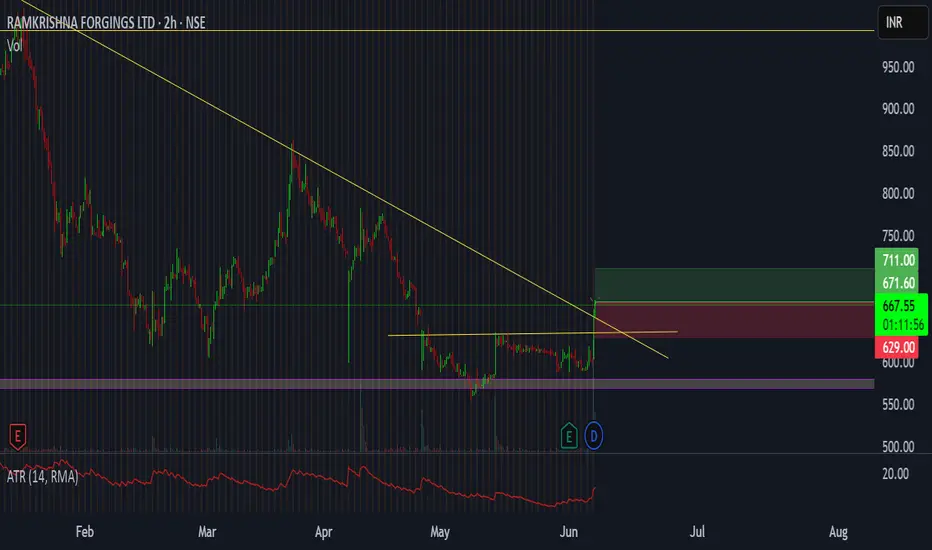
The area around 575 is a strong support on daily and weekly chart (long term support),
In the last four months, the stock has bounced off from around this level with a rise in volume,
every time higher than the previous,
A triangular pattern is also visible , having formed during this period, and now a small rectangular pattern is also visible,
A breakout through all of these has occurred today
Thus, for a short term trade,
tgt 711, sl 629
거래청산: 스탑 닿음
면책사항
이 정보와 게시물은 TradingView에서 제공하거나 보증하는 금융, 투자, 거래 또는 기타 유형의 조언이나 권고 사항을 의미하거나 구성하지 않습니다. 자세한 내용은 이용 약관을 참고하세요.
면책사항
이 정보와 게시물은 TradingView에서 제공하거나 보증하는 금융, 투자, 거래 또는 기타 유형의 조언이나 권고 사항을 의미하거나 구성하지 않습니다. 자세한 내용은 이용 약관을 참고하세요.