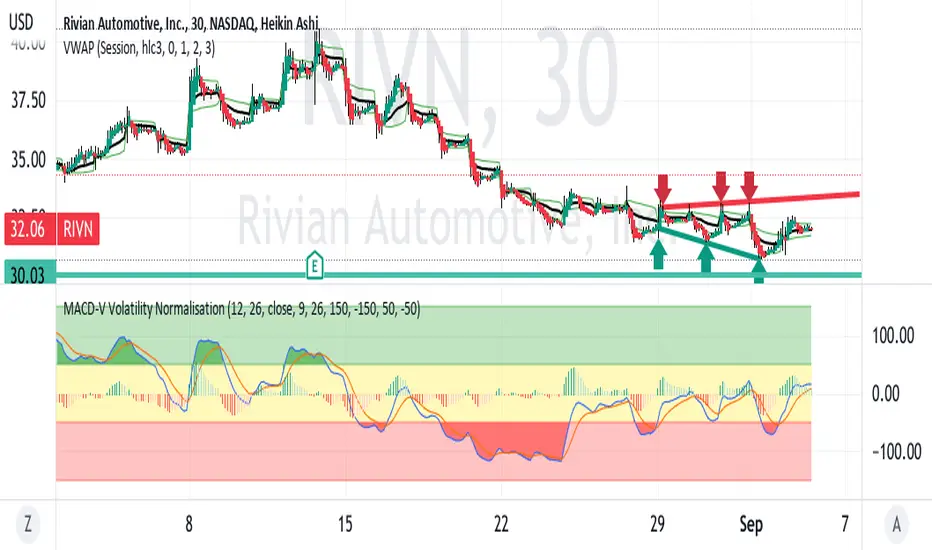
RIVN is in a slow down trending pattern right now within a megaphone
reflecting increasing volatility. The MACD shows the downward momentum
with more of the histogram negative below the zero level.
At present, the K / D lines are crossing over and above the histogram.
characteristic of a reversal to the downside.
Based on pivots in June and July, the horizontal support is at ~ $30.
Accordingly, a target on a short trade setup is just before $30.
This appears to be a good short trade setup where Rivian is
following the downtrend of the sector leader TSLA.
면책사항
해당 정보와 게시물은 금융, 투자, 트레이딩 또는 기타 유형의 조언이나 권장 사항으로 간주되지 않으며, 트레이딩뷰에서 제공하거나 보증하는 것이 아닙니다. 자세한 내용은 이용 약관을 참조하세요.
면책사항
해당 정보와 게시물은 금융, 투자, 트레이딩 또는 기타 유형의 조언이나 권장 사항으로 간주되지 않으며, 트레이딩뷰에서 제공하거나 보증하는 것이 아닙니다. 자세한 내용은 이용 약관을 참조하세요.