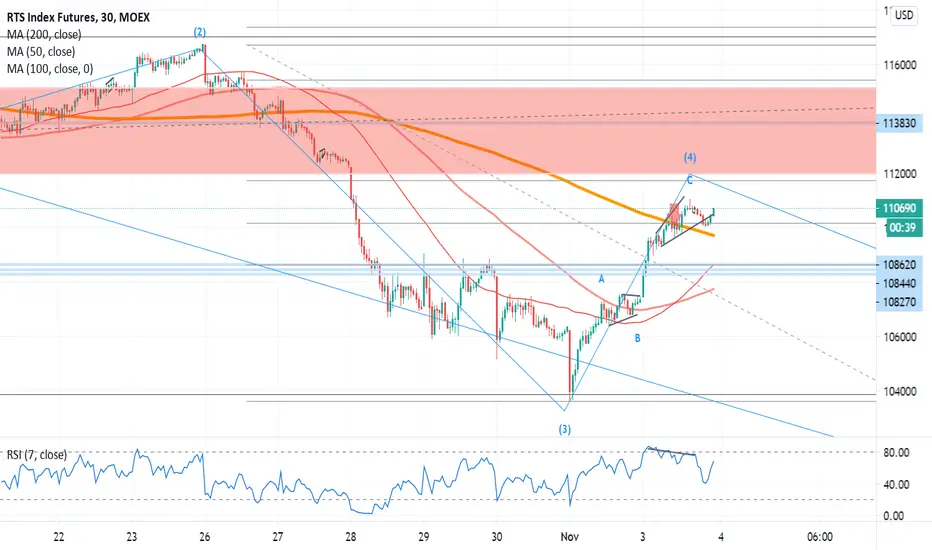
It looks like RTS has just completed wave 4 (before US ballot results announcement) with a simple ABC, with wave 5 of C coming out as an expanding diagonal confirmed by RSI divergence. This is a perfect setup. The timeframe is a bit too low but hey looks good. The tip of the wave 4 is marked with bearish candles on every timeframe starting from 1 min to Daily.
➡️t.me/charta_energeia — regular Elliott Wave and trend analysis on Oil, Gas, and Crypto.
면책사항
해당 정보와 게시물은 금융, 투자, 트레이딩 또는 기타 유형의 조언이나 권장 사항으로 간주되지 않으며, 트레이딩뷰에서 제공하거나 보증하는 것이 아닙니다. 자세한 내용은 이용 약관을 참조하세요.
➡️t.me/charta_energeia — regular Elliott Wave and trend analysis on Oil, Gas, and Crypto.
면책사항
해당 정보와 게시물은 금융, 투자, 트레이딩 또는 기타 유형의 조언이나 권장 사항으로 간주되지 않으며, 트레이딩뷰에서 제공하거나 보증하는 것이 아닙니다. 자세한 내용은 이용 약관을 참조하세요.