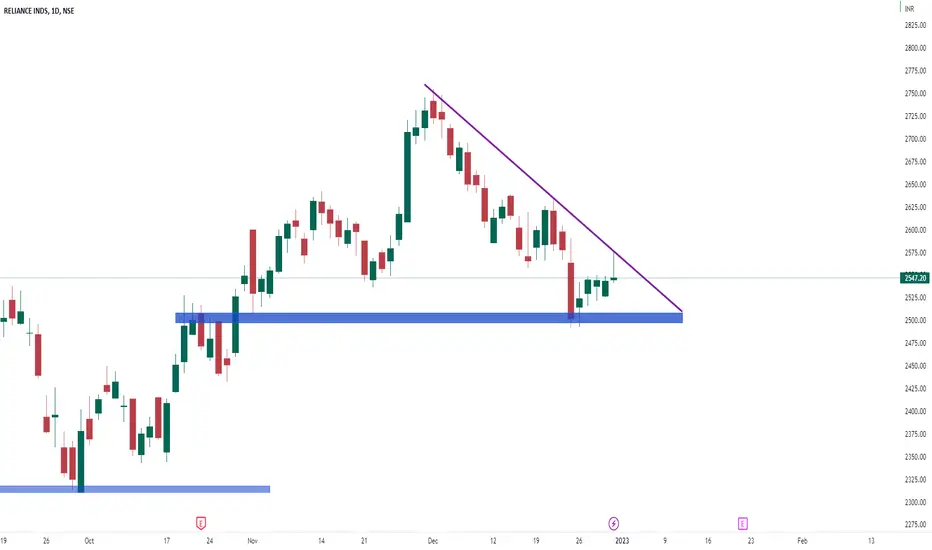
Day chart of reliance ind
it is making triangle pattern on daily chart in which important support zone is 2490 zone and Resistance is trendline
& today it is making inverse hammer candle which indicates bearish view for monday. On monday if this stocks breaks friday low then I will start shorting.
it is making triangle pattern on daily chart in which important support zone is 2490 zone and Resistance is trendline
& today it is making inverse hammer candle which indicates bearish view for monday. On monday if this stocks breaks friday low then I will start shorting.
면책사항
이 정보와 게시물은 TradingView에서 제공하거나 보증하는 금융, 투자, 거래 또는 기타 유형의 조언이나 권고 사항을 의미하거나 구성하지 않습니다. 자세한 내용은 이용 약관을 참고하세요.
면책사항
이 정보와 게시물은 TradingView에서 제공하거나 보증하는 금융, 투자, 거래 또는 기타 유형의 조언이나 권고 사항을 의미하거나 구성하지 않습니다. 자세한 내용은 이용 약관을 참고하세요.