We are going to see the daily and weekly charts. It's beautiful to see how the patterns are aligning.
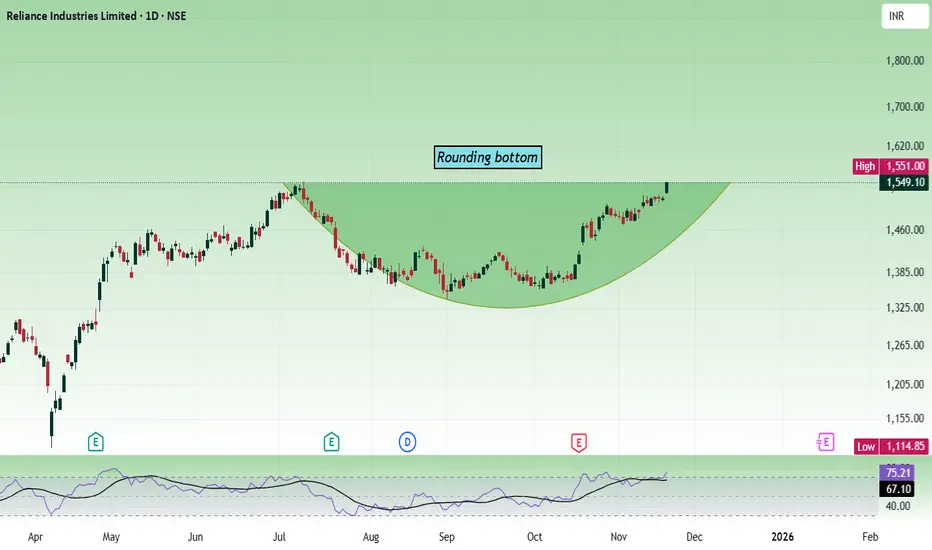
The daily chart shows, the price has formed a rounding bottom, and right now it is testing the rounding bottom resistance/high.
The weekly chart shows, the price is nearing the cup and handle pattern resistance, which is around the zone 1600. Support is at 1350.

Any dip can be used as a buying opportunity as long as the price is above 1350.
As per the daily chart, we can enter above 1520 with the stop loss of 1470 for the targets 1560, 1590, 1615, 1640, 1676 and 1712. If the price has enough bullish strength, it can test the 1800 and then the 2000 zone.
Always do your analysis before taking any trade.
The daily chart shows, the price has formed a rounding bottom, and right now it is testing the rounding bottom resistance/high.
The weekly chart shows, the price is nearing the cup and handle pattern resistance, which is around the zone 1600. Support is at 1350.
Any dip can be used as a buying opportunity as long as the price is above 1350.
As per the daily chart, we can enter above 1520 with the stop loss of 1470 for the targets 1560, 1590, 1615, 1640, 1676 and 1712. If the price has enough bullish strength, it can test the 1800 and then the 2000 zone.
Always do your analysis before taking any trade.
Role I play here : Moderator. Follow me in telegram to trade better. t.me/Analysis4Newbie Contact information : tradingplan4u@gmail.com
면책사항
해당 정보와 게시물은 금융, 투자, 트레이딩 또는 기타 유형의 조언이나 권장 사항으로 간주되지 않으며, 트레이딩뷰에서 제공하거나 보증하는 것이 아닙니다. 자세한 내용은 이용 약관을 참조하세요.
Role I play here : Moderator. Follow me in telegram to trade better. t.me/Analysis4Newbie Contact information : tradingplan4u@gmail.com
면책사항
해당 정보와 게시물은 금융, 투자, 트레이딩 또는 기타 유형의 조언이나 권장 사항으로 간주되지 않으며, 트레이딩뷰에서 제공하거나 보증하는 것이 아닙니다. 자세한 내용은 이용 약관을 참조하세요.