📊 Monthly Pivot Levels (October 2025)
Based on monthly pivot point analysis, key technical levels are as follows:
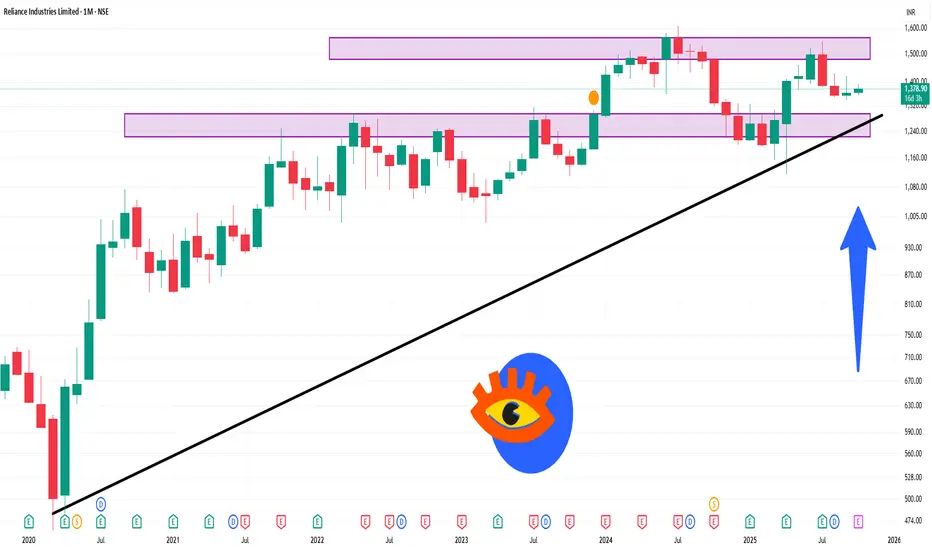
Pivot Point: ₹1,375.53
Resistance Levels: ₹1,410.47 (R1), ₹1,456.93 (R2), ₹1,491.87 (R3)
Support Levels: ₹1,329.07 (S1), ₹1,294.13 (S2), ₹1,247.67 (S3)
The pivot point of ₹1,375.53 indicates a neutral sentiment. Trading above this level may suggest bullish momentum, while trading below it could indicate bearish pressure.
📈 Technical Indicators Summary
RSI (14-day): Approximately 50.55, indicating a neutral market condition.
MACD: 0.190, suggesting a mild bullish trend.
Moving Averages: Neutral outlook with equal buy and sell signals across various timeframes.
Based on monthly pivot point analysis, key technical levels are as follows:
Pivot Point: ₹1,375.53
Resistance Levels: ₹1,410.47 (R1), ₹1,456.93 (R2), ₹1,491.87 (R3)
Support Levels: ₹1,329.07 (S1), ₹1,294.13 (S2), ₹1,247.67 (S3)
The pivot point of ₹1,375.53 indicates a neutral sentiment. Trading above this level may suggest bullish momentum, while trading below it could indicate bearish pressure.
📈 Technical Indicators Summary
RSI (14-day): Approximately 50.55, indicating a neutral market condition.
MACD: 0.190, suggesting a mild bullish trend.
Moving Averages: Neutral outlook with equal buy and sell signals across various timeframes.
관련 발행물
면책사항
이 정보와 게시물은 TradingView에서 제공하거나 보증하는 금융, 투자, 거래 또는 기타 유형의 조언이나 권고 사항을 의미하거나 구성하지 않습니다. 자세한 내용은 이용 약관을 참고하세요.
관련 발행물
면책사항
이 정보와 게시물은 TradingView에서 제공하거나 보증하는 금융, 투자, 거래 또는 기타 유형의 조언이나 권고 사항을 의미하거나 구성하지 않습니다. 자세한 내용은 이용 약관을 참고하세요.