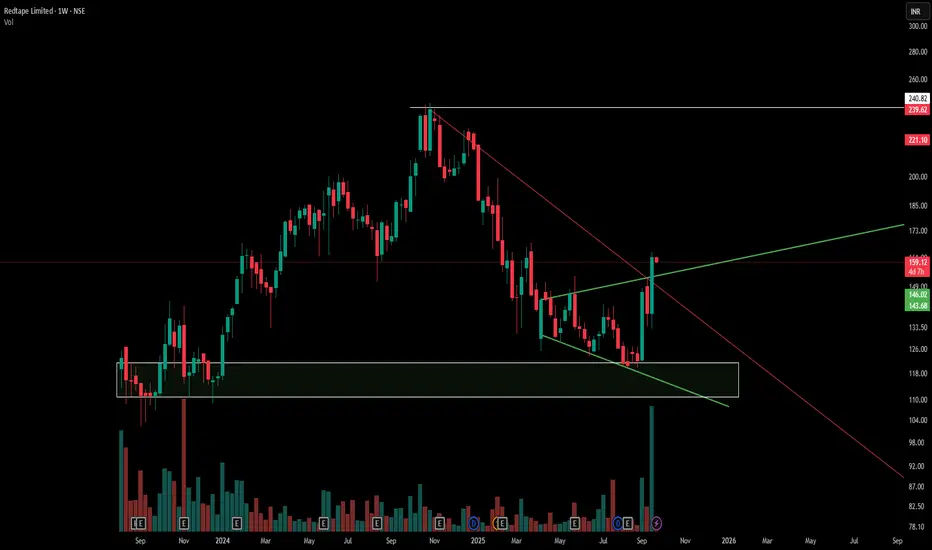
This chart offers a deep dive into three vital technical pillars:
1) White Box -The demand box marks a price area where buying strength repeatedly emerges, acting as a support anchor.
2) White line - The supply line overhead identifies zones where selling pressure historically dominates, framing resistance.
3) The Red line -A red counter trendline (CT) tracks recent corrective moves against the broader swing, helping isolate short-term rotation.
4) The Green line -Overlaying these, the green broadening pattern signals consolidation through widening highs and lows—a structure often missed at first glance.
By stacking supply, demand, counter trendlines, and broadening consolidation, traders can recognize layered market behavior. Patterns rarely exist in isolation; understanding their interplay builds disciplined chart reading skills and deepens price action insight.
Disclaimer: This content is for educational purposes and not financial advice. Always do your own research before making trading decisions.
🎯 Master My Self-Made Trading Strategy
📈 Telegram (Learn Today): t.me/hashtaghammer
✅ WhatsApp (Learn Today): wa.me/919455664601
📈 Telegram (Learn Today): t.me/hashtaghammer
✅ WhatsApp (Learn Today): wa.me/919455664601
관련 발행물
면책사항
해당 정보와 게시물은 금융, 투자, 트레이딩 또는 기타 유형의 조언이나 권장 사항으로 간주되지 않으며, 트레이딩뷰에서 제공하거나 보증하는 것이 아닙니다. 자세한 내용은 이용 약관을 참조하세요.