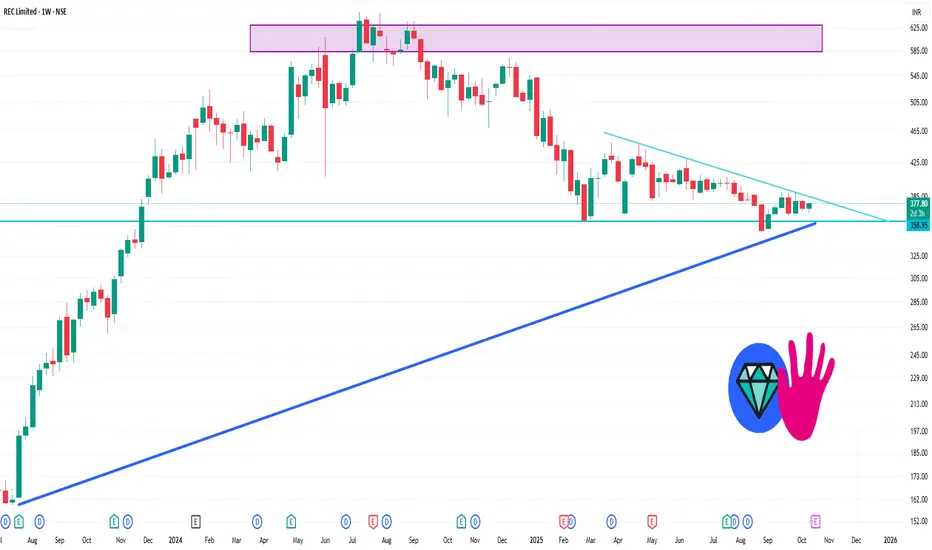
📊 Weekly Support & Resistance Levels
Immediate Support: ₹367.92
Key Support: ₹362.88
Immediate Resistance: ₹379.97
Key Resistance: ₹386.98
Weekly Trading Range: ₹355.87 – ₹392.02
🔍 Technical Indicators
RSI (14-day): 50.58 — Indicates a neutral momentum
MACD: -1.16 — Suggests a bearish trend
ADX: 15.79 — Indicates a weak trend
Stochastic RSI: 27.40 — Indicates an oversold condition
Moving Averages: Both short-term and long-term moving averages are neutral, with no clear buy or sell signals.
📈 Trend Analysis
Short-Term Trend: Neutral
Mid-Term Trend: Bearish
Long-Term Trend: Bearish
Resistance Levels: ₹386.7 (short-term), ₹391.55 (mid-term), ₹446.25 (long-term)
Support Levels: ₹364.3 (short-term), ₹350 (mid-term), ₹350 (long-term)
관련 발행물
면책사항
해당 정보와 게시물은 금융, 투자, 트레이딩 또는 기타 유형의 조언이나 권장 사항으로 간주되지 않으며, 트레이딩뷰에서 제공하거나 보증하는 것이 아닙니다. 자세한 내용은 이용 약관을 참조하세요.
관련 발행물
면책사항
해당 정보와 게시물은 금융, 투자, 트레이딩 또는 기타 유형의 조언이나 권장 사항으로 간주되지 않으며, 트레이딩뷰에서 제공하거나 보증하는 것이 아닙니다. 자세한 내용은 이용 약관을 참조하세요.