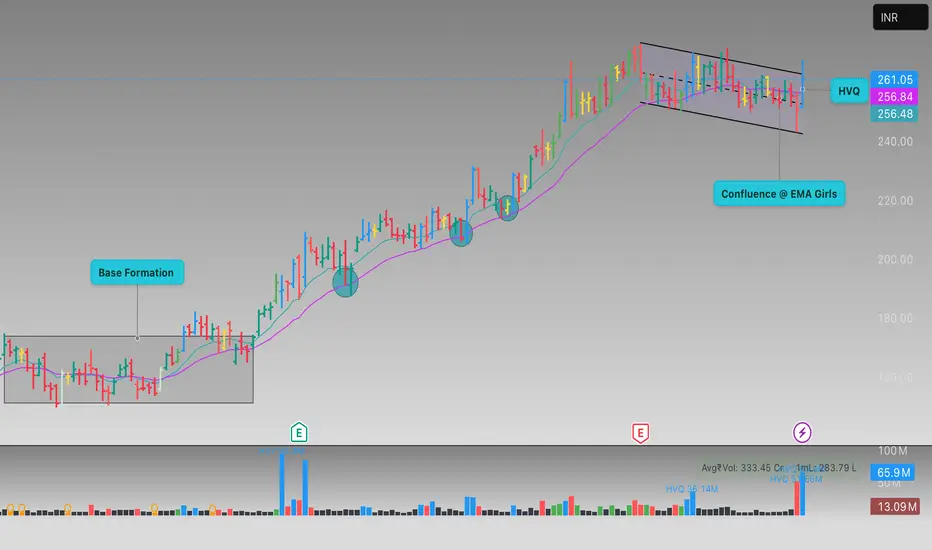
This TradingView chart displays the daily candlestick price movement of RBLBANK in INR, highlighting important technical patterns and zones. The chart features a “Base Formation” region, an upward breakout followed by steady bullish momentum, and a consolidation phase (flag channel) at higher levels. Key technical elements include two Exponential Moving Averages (EMAs), support and resistance zones, and high volume clusters (HVQ) indicating significant trading activity. Annotations such as “Confluence @ EMA” and volume bars further assist in identifying potential entry and exit points for traders.
면책사항
이 정보와 게시물은 TradingView에서 제공하거나 보증하는 금융, 투자, 거래 또는 기타 유형의 조언이나 권고 사항을 의미하거나 구성하지 않습니다. 자세한 내용은 이용 약관을 참고하세요.
면책사항
이 정보와 게시물은 TradingView에서 제공하거나 보증하는 금융, 투자, 거래 또는 기타 유형의 조언이나 권고 사항을 의미하거나 구성하지 않습니다. 자세한 내용은 이용 약관을 참고하세요.