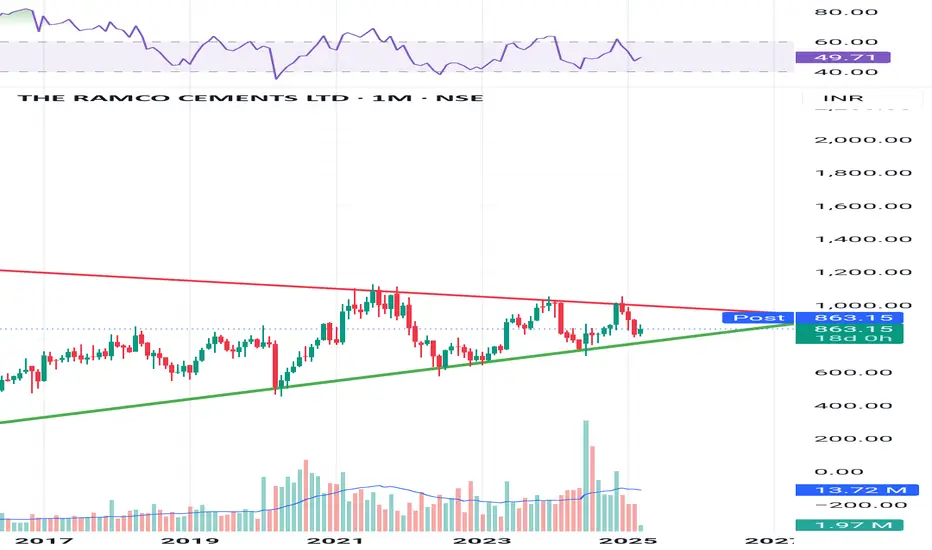
This chart shows The Ramco Cements Ltd on a monthly timeframe, with price action forming a clear structure.
Analysis:
Pattern: A symmetrical triangle pattern, where the price is trading within a narrowing range.
Resistance (Red Line): Around ₹1000, where the price has faced multiple rejections.
Support (Green Line): Higher lows, indicating that the long-term uptrend is still intact.
RSI: Currently around 49.71, sitting in a neutral zone — neither overbought nor oversold.
Deception Point:
If the price breaks below ₹800 and sustains, it could signal a bearish breakdown.
Conversely, a breakout above ₹1000 with volume confirmation could trigger a strong bullish rally.
Next Steps:
Wait for a breakout with volume to confirm the move.
Enter the trade only after a confirmation candle to avoid getting trapped in a false breakout.
면책사항
이 정보와 게시물은 TradingView에서 제공하거나 보증하는 금융, 투자, 거래 또는 기타 유형의 조언이나 권고 사항을 의미하거나 구성하지 않습니다. 자세한 내용은 이용 약관을 참고하세요.
면책사항
이 정보와 게시물은 TradingView에서 제공하거나 보증하는 금융, 투자, 거래 또는 기타 유형의 조언이나 권고 사항을 의미하거나 구성하지 않습니다. 자세한 내용은 이용 약관을 참고하세요.