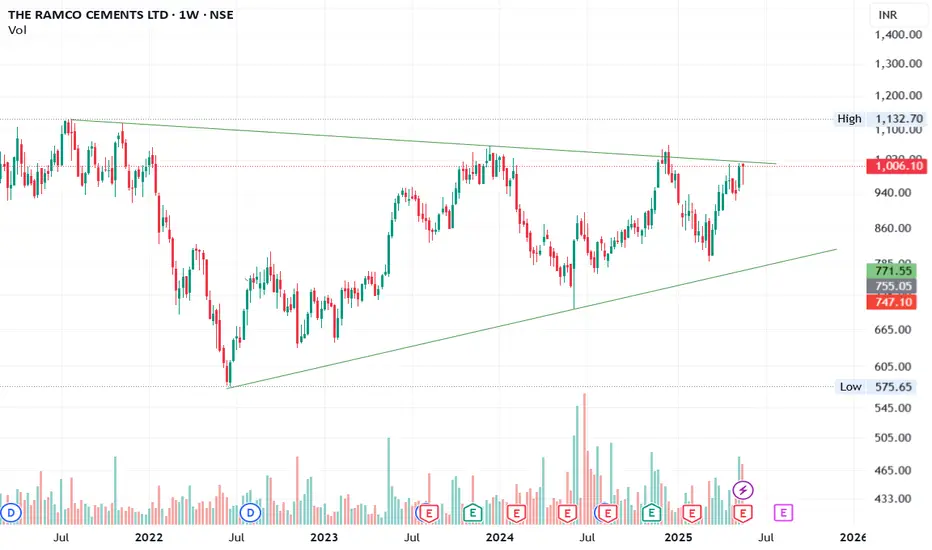
📌 Chart: Weekly | Symbol: NSE:RAMCOCEM
Ramco Cements is testing the upper resistance of a multi-year symmetrical triangle that has been forming since mid-2021. This type of consolidation often precedes a major breakout or breakdown, and we’re now at a critical decision point.
💡 Key Observations:
Price is coiling near the triangle apex — a breakout above ₹1,020 could lead to a strong momentum move.
Multiple attempts to break the upper trendline show building pressure.
Volume has started to pick up on green candles — early signs of accumulation?
Weekly RSI trending higher, signaling strength.
📈 Levels to Watch:
Breakout Zone: ₹1,010–₹1,020
Target Zones: ₹1,150 → ₹1,250+ (if breakout sustains)
Support: ₹930 (short-term), ₹870 (pattern base)
🧠 Bias: Bullish on breakout confirmation
⏳ Strategy: Wait for a close above ₹1,020 with volume. Keep SL below last swing low.
면책사항
해당 정보와 게시물은 금융, 투자, 트레이딩 또는 기타 유형의 조언이나 권장 사항으로 간주되지 않으며, 트레이딩뷰에서 제공하거나 보증하는 것이 아닙니다. 자세한 내용은 이용 약관을 참조하세요.
면책사항
해당 정보와 게시물은 금융, 투자, 트레이딩 또는 기타 유형의 조언이나 권장 사항으로 간주되지 않으며, 트레이딩뷰에서 제공하거나 보증하는 것이 아닙니다. 자세한 내용은 이용 약관을 참조하세요.