✅ Current technicals
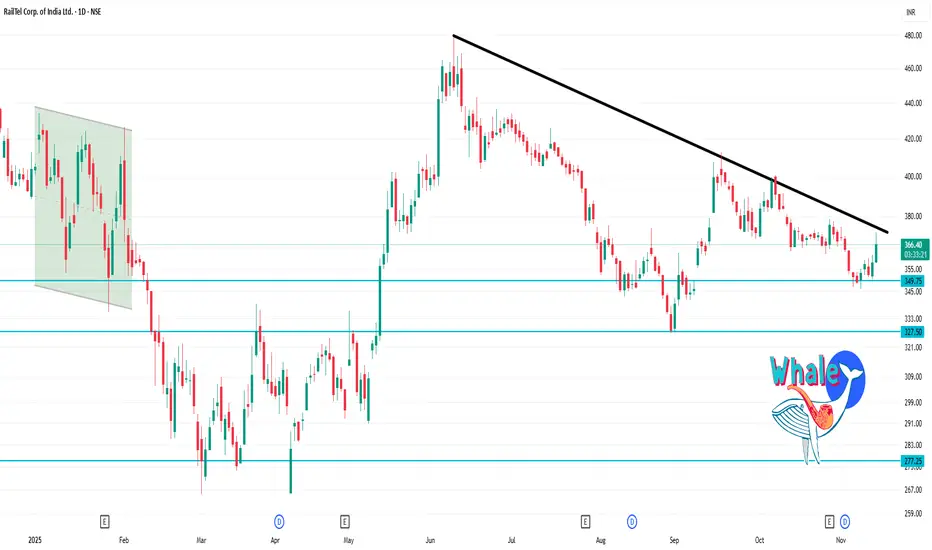
On the daily chart, the stock is near ~ ₹365.70 .
RSI(14) is ~ 63.7 → moderate momentum.
Many moving averages (20/50) are showing “buy” signals, but the 200-day is still above current price, giving a mixed picture.
Trend strength (ADX) is relatively weak/neutral, suggesting the move is not strongly trending.
🎯 Key levels (1-day timeframe)
These are approximate support/resistance and pivot levels derived from recent data.
Pivot & immediate levels
Pivot (classic) ~ ₹368.53.
Resistance 1 (R1) ~ ₹370.66.
Resistance 2 (R2) ~ ₹374.33.
Support 1 (S1) ~ ₹364.86.
Support 2 (S2) ~ ₹362.73.
Wider/more conservative zones
Major longer-term support: ~ ₹351–355 zone (from older pivot S2/S3).
Major longer‐term resistance: ~ ₹374–380 zone.
관련 발행물
면책사항
해당 정보와 게시물은 금융, 투자, 트레이딩 또는 기타 유형의 조언이나 권장 사항으로 간주되지 않으며, 트레이딩뷰에서 제공하거나 보증하는 것이 아닙니다. 자세한 내용은 이용 약관을 참조하세요.
관련 발행물
면책사항
해당 정보와 게시물은 금융, 투자, 트레이딩 또는 기타 유형의 조언이나 권장 사항으로 간주되지 않으며, 트레이딩뷰에서 제공하거나 보증하는 것이 아닙니다. 자세한 내용은 이용 약관을 참조하세요.